
- Home >
- Stock Photos >
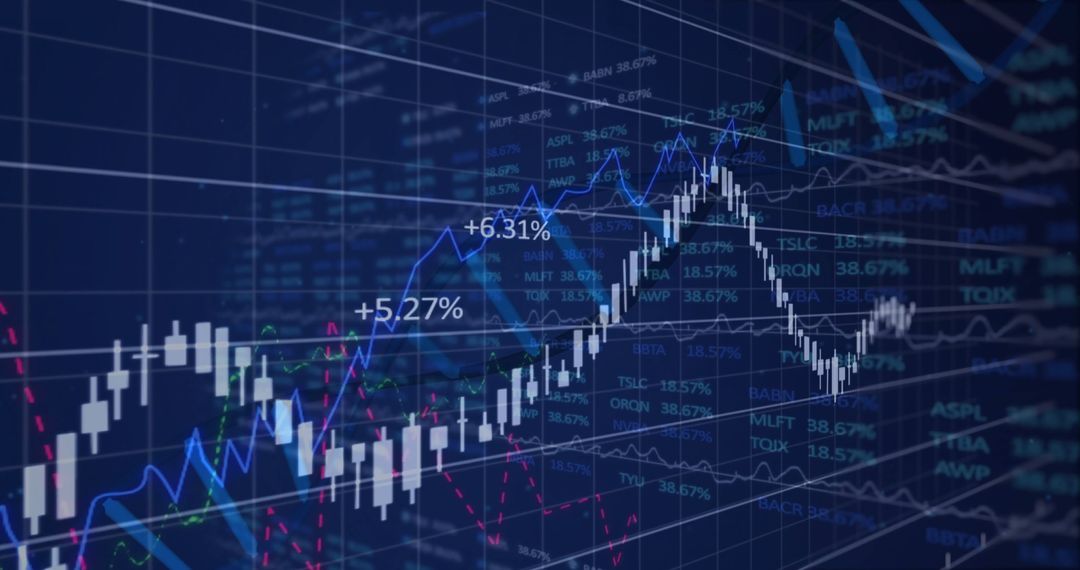
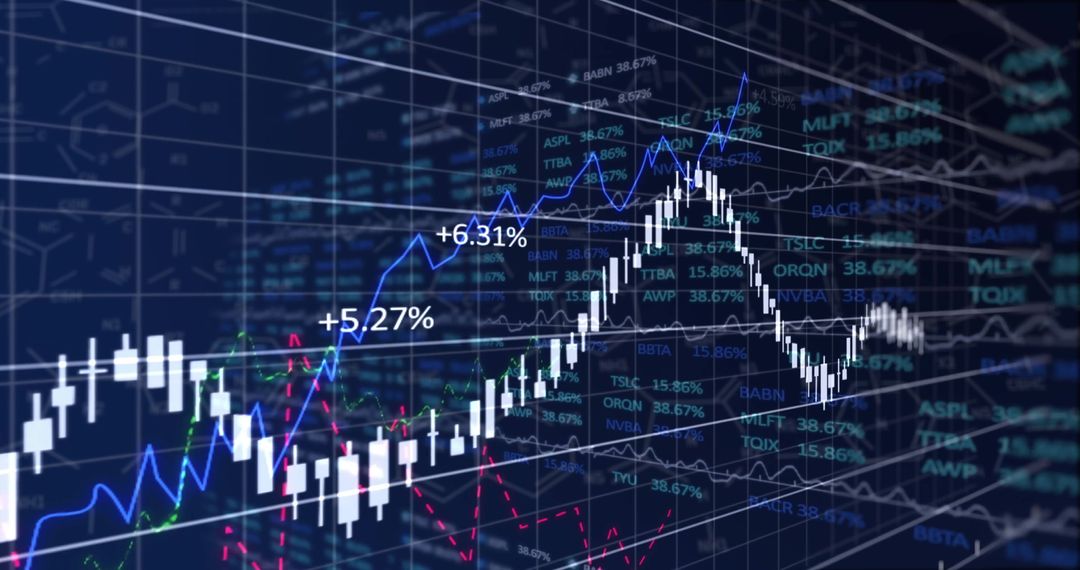
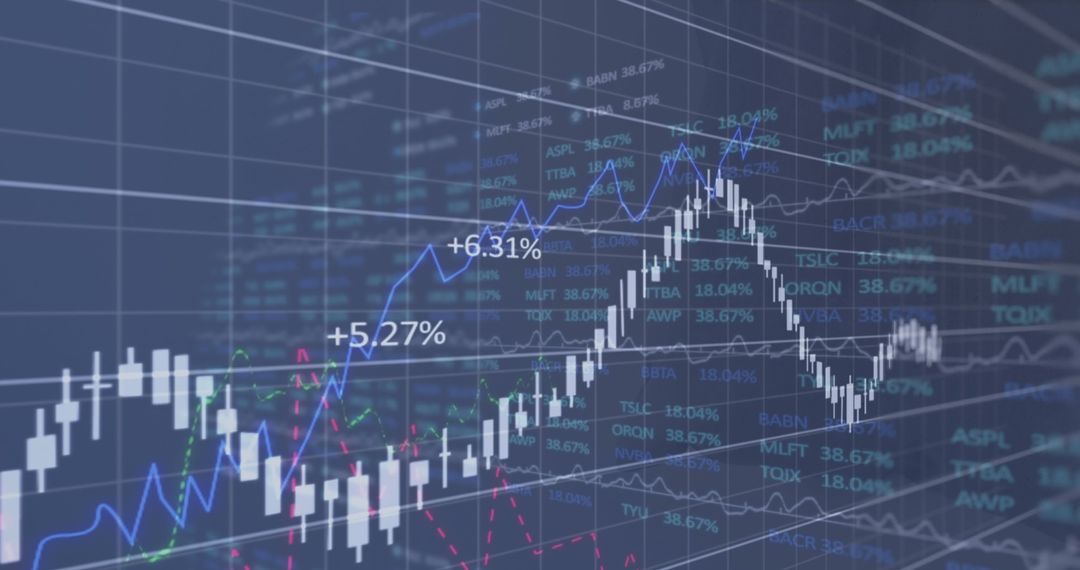
- Digital Financial Data Visualization with Candlestick Chart and Star Icons
Digital Financial Data Visualization with Candlestick Chart and Star Icons Image

This image illustrates a digital financial chart featuring candlestick patterns and trend lines to depict market analytics and investment trends. Enhanced with star icons and percentage gain markers, it showcases financial data visualization rich in analytics texture. Ideal for use in investment presentations, financial reports, data analysis workshops, or technology-focused blogs that deal dissertation on market strategies, stock analytics, or economic trends emulation.
Powered by  - Get 15% off with code: PIKWIZARD15


0
downloads
downloads
Tags:
More
Credit Photo
If you would like to credit the Photo, here are some ways you can do so
Text Link
photo Link
<span class="text-link">
<span>
<a target="_blank" href=https://pikwizard.com/photo/digital-financial-data-visualization-with-candlestick-chart-and-star-icons/6ffb0a9d9167a6fc62279c8c81138c0d/>PikWizard</a>
</span>
</span>
<span class="image-link">
<span
style="margin: 0 0 20px 0; display: inline-block; vertical-align: middle; width: 100%;"
>
<a
target="_blank"
href="https://pikwizard.com/photo/digital-financial-data-visualization-with-candlestick-chart-and-star-icons/6ffb0a9d9167a6fc62279c8c81138c0d/"
style="text-decoration: none; font-size: 10px; margin: 0;"
>
<img src="https://pikwizard.com/pw/medium/6ffb0a9d9167a6fc62279c8c81138c0d.jpg" style="margin: 0; width: 100%;" alt="" />
<p style="font-size: 12px; margin: 0;">PikWizard</p>
</a>
</span>
</span>
Free (free of charge)
Free for personal and commercial use.
Author: Awesome Content
Similar Free Stock Images

Premium


Premium


Premium


Premium


Premium


Premium


Premium


Premium


Premium


Premium


Premium


Premium


Premium


Premium


Premium


Premium


Premium


Premium


Premium


Premium


Premium


Premium


Premium


Premium

