
- Home >
- Stock Photos >
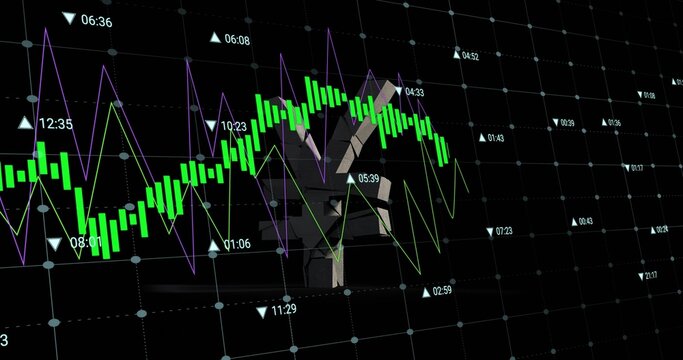
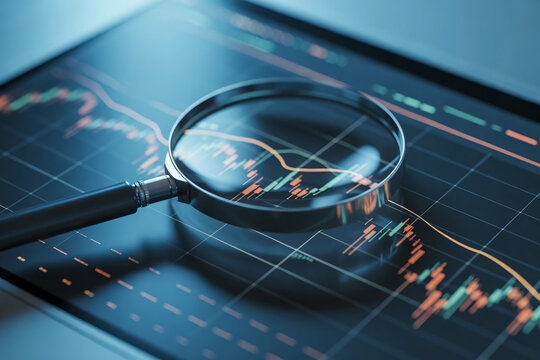
- Digital Financial Data Visualization with Candlesticks
Digital Financial Data Visualization with Candlesticks Image
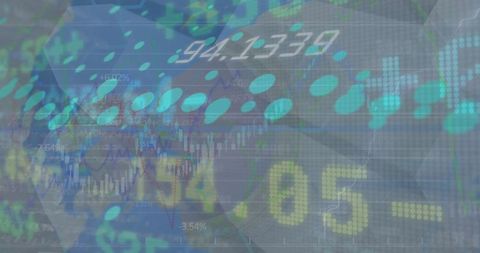
Complex financial dashboard showing a virtual interface overlay of shifting numerical data and candlestick charts, presenting elements of finance and economics. Useful for illustrating financial articles, presentations on market trends, digital finance tools, or stock market analysis events.
Powered by 


downloads
Tags:
More
Credit Photo
If you would like to credit the Photo, here are some ways you can do so
Text Link
photo Link
<span class="text-link">
<span>
<a target="_blank" href=https://pikwizard.com/photo/digital-financial-data-visualization-with-candlesticks/ac44d172052242990db7ec8b9cfb28d8/>PikWizard</a>
</span>
</span>
<span class="image-link">
<span
style="margin: 0 0 20px 0; display: inline-block; vertical-align: middle; width: 100%;"
>
<a
target="_blank"
href="https://pikwizard.com/photo/digital-financial-data-visualization-with-candlesticks/ac44d172052242990db7ec8b9cfb28d8/"
style="text-decoration: none; font-size: 10px; margin: 0;"
>
<img src="https://pikwizard.com/pw/medium/ac44d172052242990db7ec8b9cfb28d8.jpg" style="margin: 0; width: 100%;" alt="" />
<p style="font-size: 12px; margin: 0;">PikWizard</p>
</a>
</span>
</span>
Free (free of charge)
Free for personal and commercial use.
Author: People Creations