
- Home >
- Stock Photos >
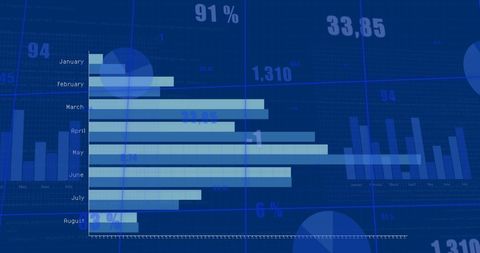
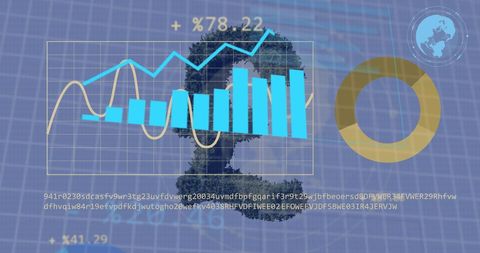
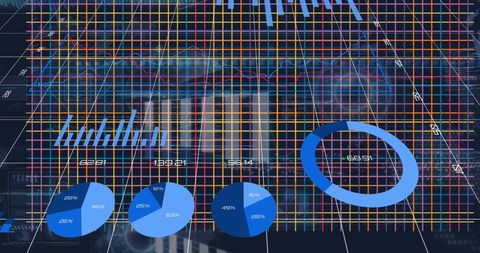
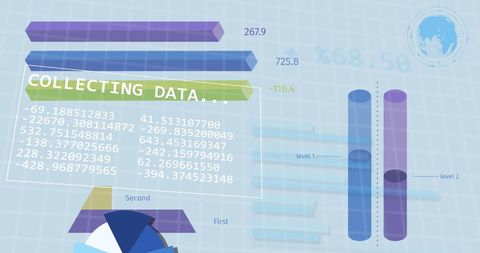
- Digital Financial Data Visualization with Charts and World Map
Digital Financial Data Visualization with Charts and World Map Image

Abstract representation of financial data processing with various charts and a world map backdrop. Suitable for use in presentations or promotional materials relating to global business trends, financial analytics, corporate strategy, and data-driven decision-making in the finance sector.
Powered by 


downloads
Tags:
More
Credit Photo
If you would like to credit the Photo, here are some ways you can do so
Text Link
photo Link
<span class="text-link">
<span>
<a target="_blank" href=https://pikwizard.com/photo/digital-financial-data-visualization-with-charts-and-world-map/bd2c5d068aa1f2000a55237721919ffa/>PikWizard</a>
</span>
</span>
<span class="image-link">
<span
style="margin: 0 0 20px 0; display: inline-block; vertical-align: middle; width: 100%;"
>
<a
target="_blank"
href="https://pikwizard.com/photo/digital-financial-data-visualization-with-charts-and-world-map/bd2c5d068aa1f2000a55237721919ffa/"
style="text-decoration: none; font-size: 10px; margin: 0;"
>
<img src="https://pikwizard.com/pw/medium/bd2c5d068aa1f2000a55237721919ffa.jpg" style="margin: 0; width: 100%;" alt="" />
<p style="font-size: 12px; margin: 0;">PikWizard</p>
</a>
</span>
</span>
Free (free of charge)
Free for personal and commercial use.
Author: Creative Art
Similar Free Stock Images

Premium

Premium

Premium


Premium


Premium

Premium

Premium

Premium


Premium


Premium


Premium

Premium


Premium


Premium

Premium


Premium


Premium

Premium


Premium

Premium


Premium


Premium


Premium


Premium


Premium

Explore More Free Stock Images