
- Home >
- Stock Photos >
- Digital Financial Data Visualization with Dynamic Charts
Digital Financial Data Visualization with Dynamic Charts Image

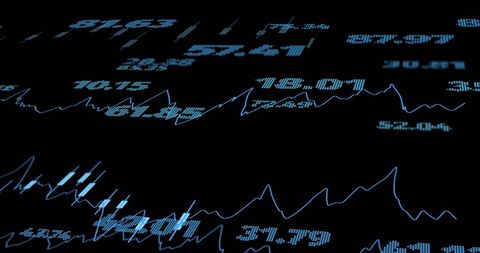
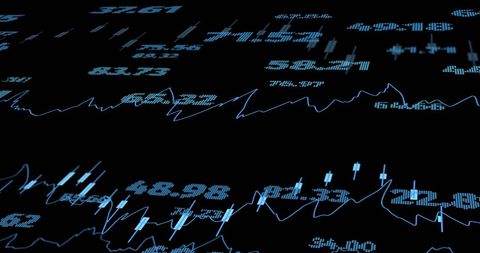
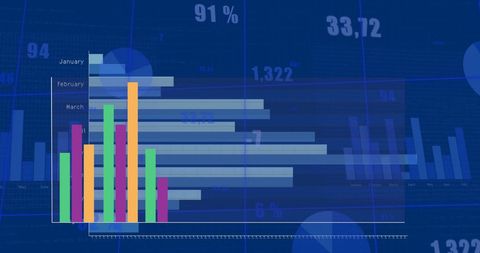
Graphical representation of financial data with colorful, dynamic charts and number overlays on black background. Symbols indicating stock trends and analytics display technological advancement in finance. Useful for financial reports, investment presentations, technology blogs, and educational materials on economics and data analysis.
Powered by 


downloads
Tags:
More
Credit Photo
If you would like to credit the Photo, here are some ways you can do so
Text Link
photo Link
<span class="text-link">
<span>
<a target="_blank" href=https://pikwizard.com/photo/digital-financial-data-visualization-with-dynamic-charts/25f614a129494b43eb1cdb461276e223/>PikWizard</a>
</span>
</span>
<span class="image-link">
<span
style="margin: 0 0 20px 0; display: inline-block; vertical-align: middle; width: 100%;"
>
<a
target="_blank"
href="https://pikwizard.com/photo/digital-financial-data-visualization-with-dynamic-charts/25f614a129494b43eb1cdb461276e223/"
style="text-decoration: none; font-size: 10px; margin: 0;"
>
<img src="https://pikwizard.com/pw/medium/25f614a129494b43eb1cdb461276e223.jpg" style="margin: 0; width: 100%;" alt="" />
<p style="font-size: 12px; margin: 0;">PikWizard</p>
</a>
</span>
</span>
Free (free of charge)
Free for personal and commercial use.
Author: Authentic Images
Similar Free Stock Images

Premium


Premium


Premium

Premium


Premium


Premium

Premium


Premium


Premium

Premium


Premium


Premium

Premium

Premium


Premium

Premium


Premium


Premium


Premium


Premium


Premium


Premium


Premium


Premium


Premium

Explore More Free Stock Images