
- Home >
- Stock Photos >
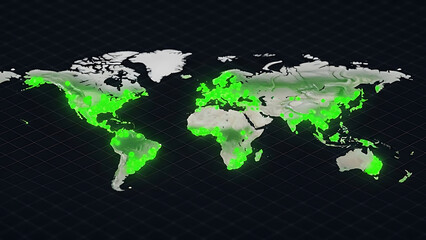
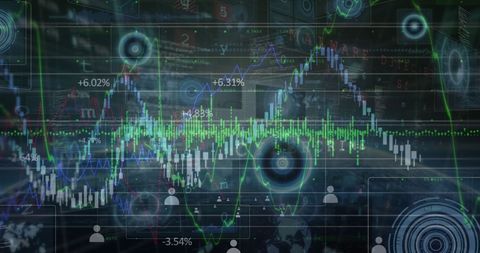
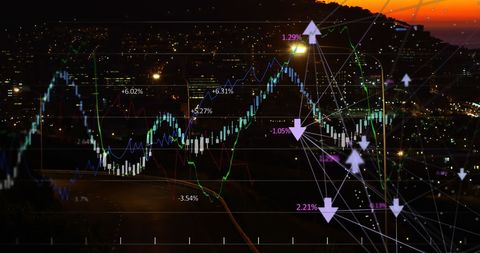
- Digital Financial Data Visualization with Global Connectivity
Digital Financial Data Visualization with Global Connectivity Image

Visual mixture of data charts and world map found within digital financial relevance, surrounds innovative aspects like business decision-making, investment strategy, trending technology discussions, and academic presentations focusing on global financial markets and technological evolution shows versatility in usage.
Powered by 


downloads
Tags:
More
Credit Photo
If you would like to credit the Photo, here are some ways you can do so
Text Link
photo Link
<span class="text-link">
<span>
<a target="_blank" href=https://pikwizard.com/photo/digital-financial-data-visualization-with-global-connectivity/3d5c746749c06334743e74fbe9b3df7e/>PikWizard</a>
</span>
</span>
<span class="image-link">
<span
style="margin: 0 0 20px 0; display: inline-block; vertical-align: middle; width: 100%;"
>
<a
target="_blank"
href="https://pikwizard.com/photo/digital-financial-data-visualization-with-global-connectivity/3d5c746749c06334743e74fbe9b3df7e/"
style="text-decoration: none; font-size: 10px; margin: 0;"
>
<img src="https://pikwizard.com/pw/medium/3d5c746749c06334743e74fbe9b3df7e.jpg" style="margin: 0; width: 100%;" alt="" />
<p style="font-size: 12px; margin: 0;">PikWizard</p>
</a>
</span>
</span>
Free (free of charge)
Free for personal and commercial use.
Author: People Creations
Similar Free Stock Images

Premium


Premium


Premium


Premium


Premium

Premium


Premium


Premium


Premium


Premium


Premium

Premium

Premium


Premium


Premium

Premium


Premium


Premium

Premium


Premium


Premium

Premium


Premium


Premium


Premium

Explore More Free Stock Images