- Home >
- Stock Photos >
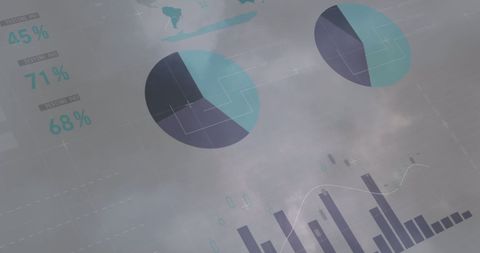
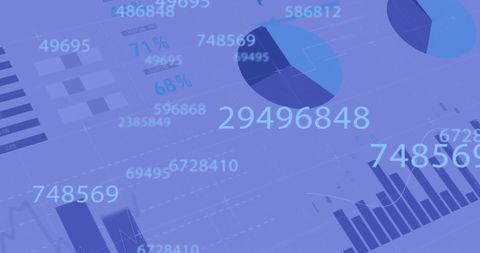
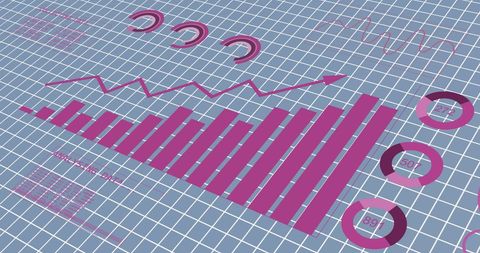
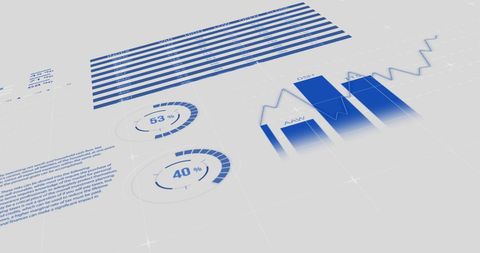
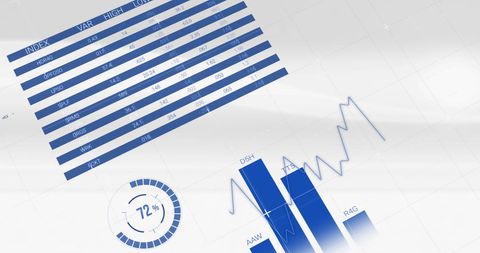
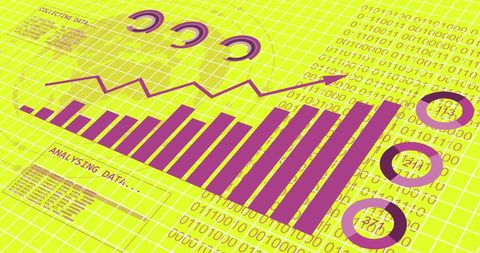
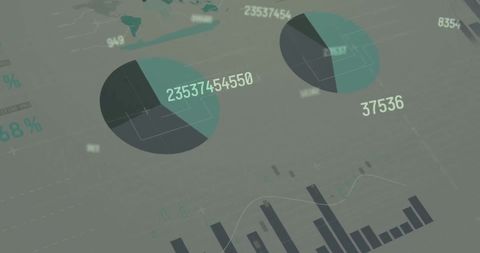
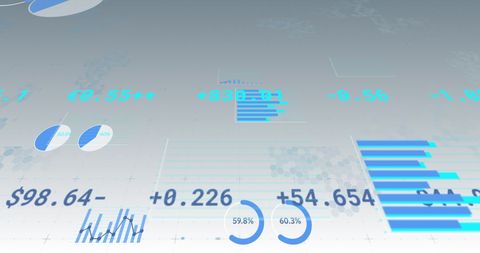
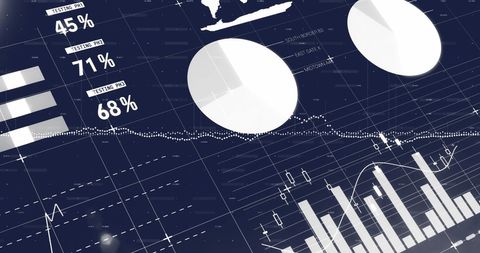
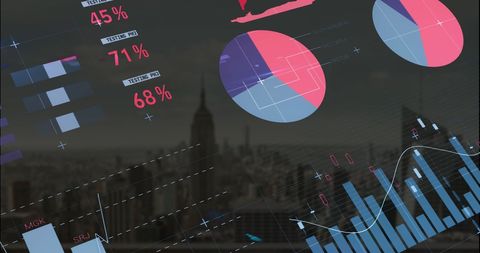
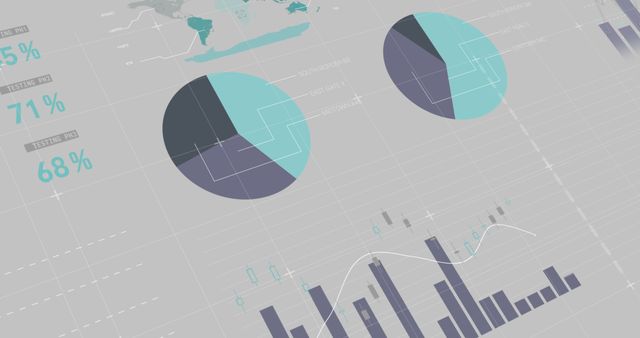
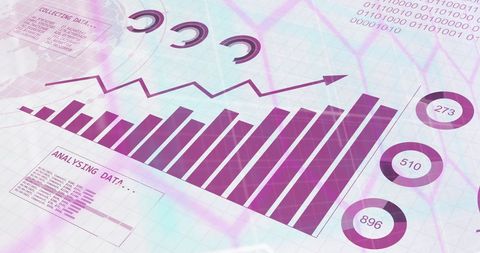
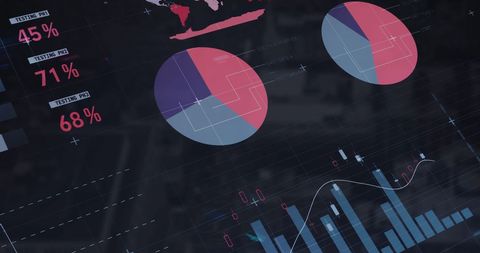
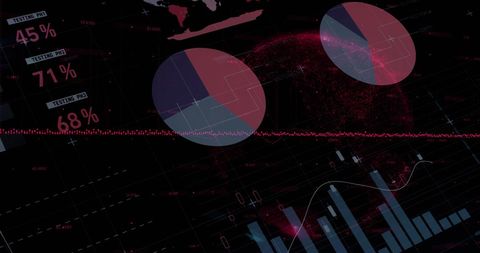
- Digital Financial Data Visualization with Global Elements
Digital Financial Data Visualization with Global Elements Image

Graphic features stylized images of graphs and charts representing financial data against a global theme. Abstract elements include zigzag lines and digital interfaces. Ideal for illustrating technological and business concepts such as data analytics, global finance, or technological innovation in presentations or reports.

downloads
Tags:
More
Credit Photo
If you would like to credit the Photo, here are some ways you can do so
Text Link
photo Link
<span class="text-link">
<span>
<a target="_blank" href=https://pikwizard.com/photo/digital-financial-data-visualization-with-global-elements/4f18174a47bd65643b4610bc9fa9f3c3/>PikWizard</a>
</span>
</span>
<span class="image-link">
<span
style="margin: 0 0 20px 0; display: inline-block; vertical-align: middle; width: 100%;"
>
<a
target="_blank"
href="https://pikwizard.com/photo/digital-financial-data-visualization-with-global-elements/4f18174a47bd65643b4610bc9fa9f3c3/"
style="text-decoration: none; font-size: 10px; margin: 0;"
>
<img src="https://pikwizard.com/pw/medium/4f18174a47bd65643b4610bc9fa9f3c3.jpg" style="margin: 0; width: 100%;" alt="" />
<p style="font-size: 12px; margin: 0;">PikWizard</p>
</a>
</span>
</span>
Free (free of charge)
Free for personal and commercial use.
Author: People Creations