
- Home >
- Stock Photos >
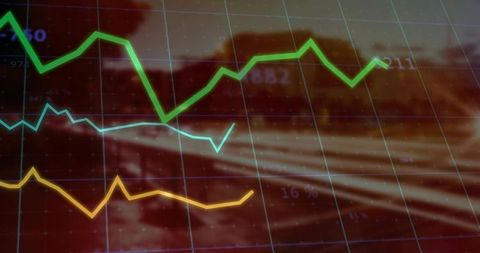
- Digital Financial Data Visualization with Graph and Metrics
Digital Financial Data Visualization with Graph and Metrics Image

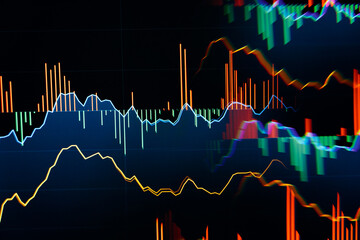
Illustrates complex financial data represented through a digital graph with real-time metrics. Suitable for financial reports, presentations, and articles discussing global business trends, stock market analyses, or technological advancements in finance. Ideal for virtual workshops or teaching materials dedicated to economic concepts or investment strategies.
Powered by 


downloads
Tags:
More
Credit Photo
If you would like to credit the Photo, here are some ways you can do so
Text Link
photo Link
<span class="text-link">
<span>
<a target="_blank" href=https://pikwizard.com/photo/digital-financial-data-visualization-with-graph-and-metrics/724e81b1cd40c4e979e21ade5e670559/>PikWizard</a>
</span>
</span>
<span class="image-link">
<span
style="margin: 0 0 20px 0; display: inline-block; vertical-align: middle; width: 100%;"
>
<a
target="_blank"
href="https://pikwizard.com/photo/digital-financial-data-visualization-with-graph-and-metrics/724e81b1cd40c4e979e21ade5e670559/"
style="text-decoration: none; font-size: 10px; margin: 0;"
>
<img src="https://pikwizard.com/pw/medium/724e81b1cd40c4e979e21ade5e670559.jpg" style="margin: 0; width: 100%;" alt="" />
<p style="font-size: 12px; margin: 0;">PikWizard</p>
</a>
</span>
</span>
Free (free of charge)
Free for personal and commercial use.
Author: People Creations
Similar Free Stock Images

Premium


Premium

Premium


Premium


Premium


Premium


Premium


Premium


Premium


Premium


Premium


Premium


Premium


Premium


Premium


Premium


Premium


Premium


Premium

Premium


Premium


Premium

Premium


Premium


Premium


Explore More Free Stock Images