- Home >
- Stock Photos >
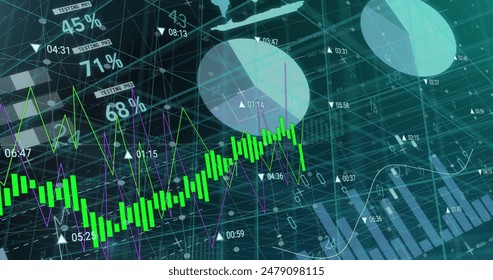
- Digital Financial Data Visualization with Graphs and Charts in Background
Digital Financial Data Visualization with Graphs and Charts in Background Image

Visualization shows complex financial data graphics superimposed over dark grid backdrop. Chart features include bars and line graphs, suggesting global economics and investment analysis. Useful for illustrating modern financial studies, tech finance projects, business strategy presentations, or digital investment platforms.
Powered by  - Get 15% off with code: PIKWIZARD15


downloads
Tags:
More
Credit Photo
If you would like to credit the Photo, here are some ways you can do so
Text Link
photo Link
<span class="text-link">
<span>
<a target="_blank" href=https://pikwizard.com/photo/digital-financial-data-visualization-with-graphs-and-charts-in-background/ac46c5471e8dd0c81c31a6ac728470c8/>PikWizard</a>
</span>
</span>
<span class="image-link">
<span
style="margin: 0 0 20px 0; display: inline-block; vertical-align: middle; width: 100%;"
>
<a
target="_blank"
href="https://pikwizard.com/photo/digital-financial-data-visualization-with-graphs-and-charts-in-background/ac46c5471e8dd0c81c31a6ac728470c8/"
style="text-decoration: none; font-size: 10px; margin: 0;"
>
<img src="https://pikwizard.com/pw/medium/ac46c5471e8dd0c81c31a6ac728470c8.jpg" style="margin: 0; width: 100%;" alt="" />
<p style="font-size: 12px; margin: 0;">PikWizard</p>
</a>
</span>
</span>
Free (free of charge)
Free for personal and commercial use.
Author: Creative Art
Similar Free Stock Images
Loading...

Premium


Premium

Premium


Premium


Premium


Premium


Premium

Premium

Premium


Premium

Premium

Premium


Premium

Premium


Premium


Premium


Premium


Premium

Premium


Premium


Premium


Premium


Premium


Premium


Premium