- Home >
- Stock Photos >
- Digital Financial Data Visualization with Graphs
Digital Financial Data Visualization with Graphs Image

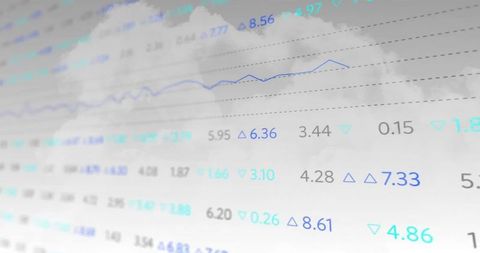
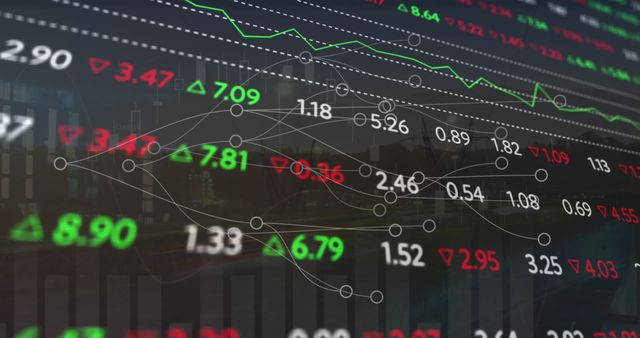
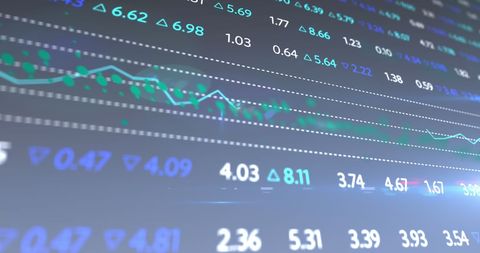
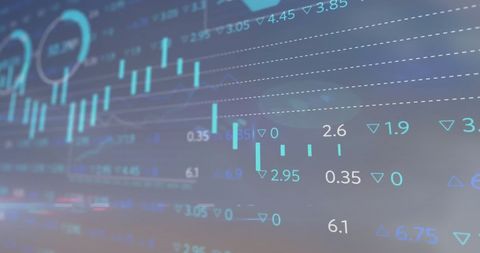
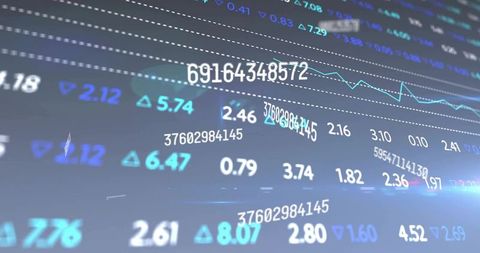
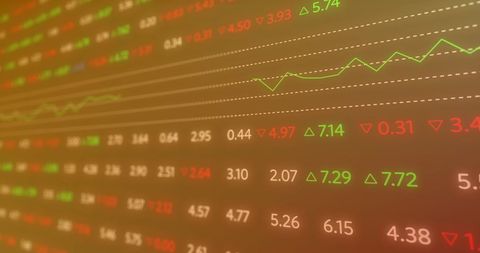
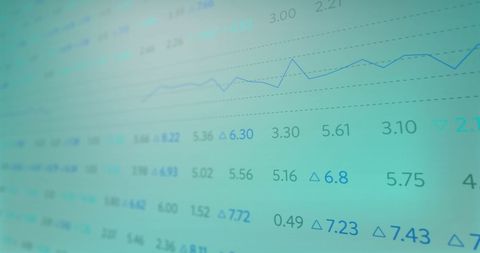
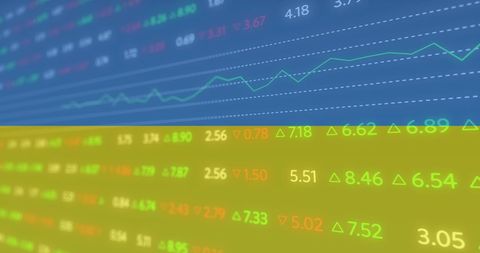
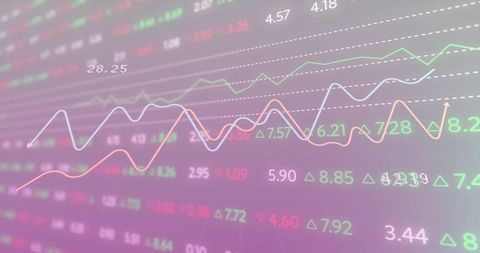
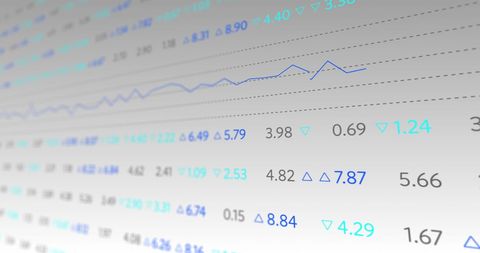
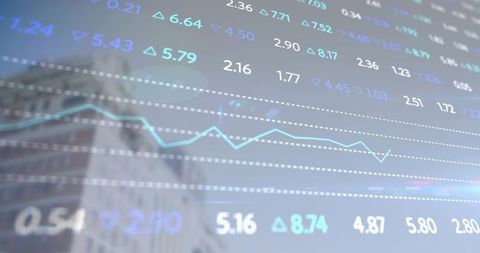
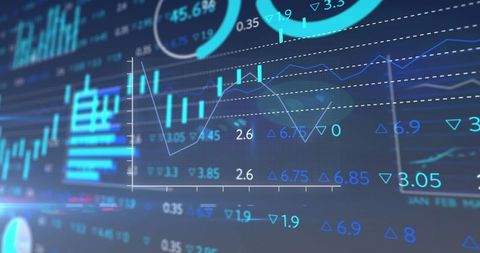
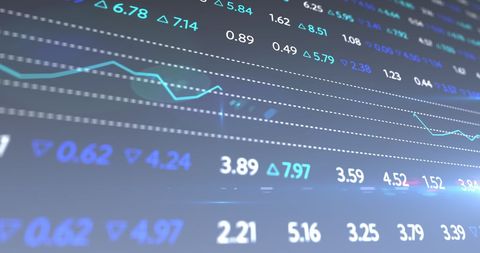
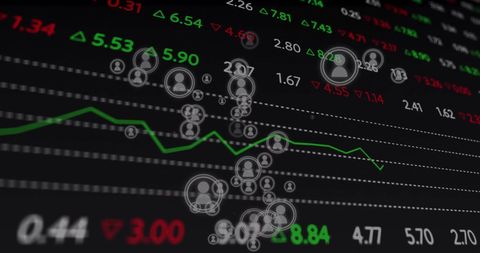
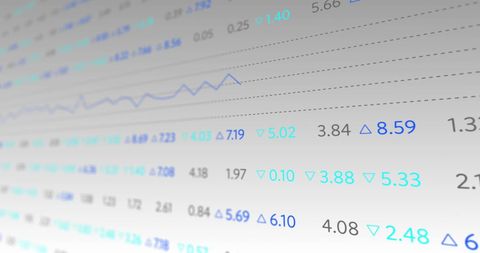
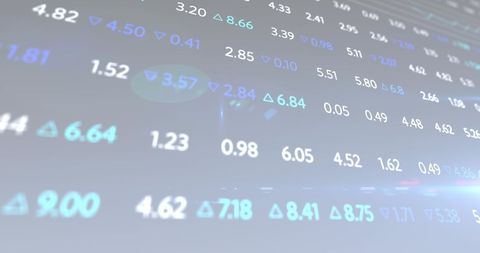
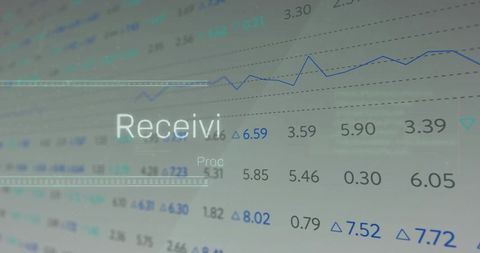
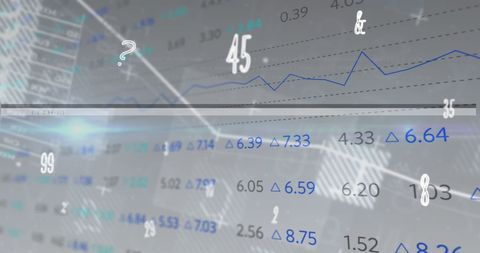
Depicting various graphs and numbers, this visualization illustrates financial data analysis ideal for conveying concepts of stock market trends, economic forecasting, or technological interfaces. Perfect for use in articles on financial technology, economic forecasts, or business strategy presentations.

downloads
Tags:
More
Credit Photo
If you would like to credit the Photo, here are some ways you can do so
Text Link
photo Link
<span class="text-link">
<span>
<a target="_blank" href=https://pikwizard.com/photo/digital-financial-data-visualization-with-graphs/7c6e6c8fd9c4ef4d2702dda66a97baf6/>PikWizard</a>
</span>
</span>
<span class="image-link">
<span
style="margin: 0 0 20px 0; display: inline-block; vertical-align: middle; width: 100%;"
>
<a
target="_blank"
href="https://pikwizard.com/photo/digital-financial-data-visualization-with-graphs/7c6e6c8fd9c4ef4d2702dda66a97baf6/"
style="text-decoration: none; font-size: 10px; margin: 0;"
>
<img src="https://pikwizard.com/pw/medium/7c6e6c8fd9c4ef4d2702dda66a97baf6.jpg" style="margin: 0; width: 100%;" alt="" />
<p style="font-size: 12px; margin: 0;">PikWizard</p>
</a>
</span>
</span>
Free (free of charge)
Free for personal and commercial use.
Author: Creative Art