
- Home >
- Stock Photos >
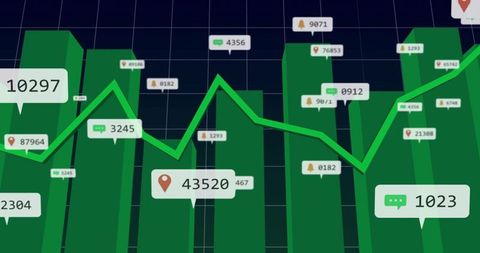
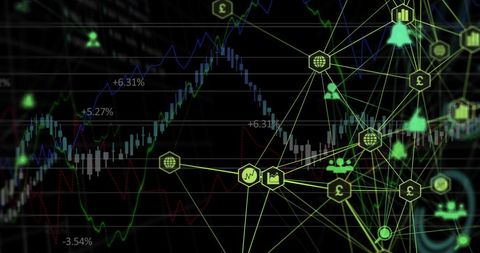
- Digital Financial Data Visualization with Green Analytics Overlay
Digital Financial Data Visualization with Green Analytics Overlay Image
Visual representation of financial data featuring line and bar graphs highlighted with a green analytics overlay. Lines and numbers convey dynamic stock market movements and digital economics. This could be used for illustrating concepts in financial reports, educational materials on data analysis, or promoting financial services and technology.
Powered by 


downloads
Tags:
More
Credit Photo
If you would like to credit the Photo, here are some ways you can do so
Text Link
photo Link
<span class="text-link">
<span>
<a target="_blank" href=https://pikwizard.com/photo/digital-financial-data-visualization-with-green-analytics-overlay/55c77f8b018de89a251ad833c6d717ea/>PikWizard</a>
</span>
</span>
<span class="image-link">
<span
style="margin: 0 0 20px 0; display: inline-block; vertical-align: middle; width: 100%;"
>
<a
target="_blank"
href="https://pikwizard.com/photo/digital-financial-data-visualization-with-green-analytics-overlay/55c77f8b018de89a251ad833c6d717ea/"
style="text-decoration: none; font-size: 10px; margin: 0;"
>
<img src="https://pikwizard.com/pw/medium/55c77f8b018de89a251ad833c6d717ea.jpg" style="margin: 0; width: 100%;" alt="" />
<p style="font-size: 12px; margin: 0;">PikWizard</p>
</a>
</span>
</span>
Free (free of charge)
Free for personal and commercial use.
Author: Creative Art
Similar Free Stock Images

Premium


Premium

Premium


Premium


Premium


Premium


Premium


Premium


Premium

Premium


Premium


Premium

Premium


Premium


Premium


Premium


Premium


Premium

Premium

Premium


Premium

Premium


Premium

Premium

Premium


Explore More Free Stock Images