
- Home >
- Stock Photos >
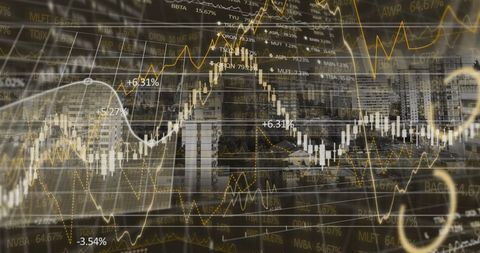
- Digital Financial Data Visualization with Increasing Graph
Digital Financial Data Visualization with Increasing Graph Image

Abstract background featuring digital processing of financial data superimposed with rising trend graph. Ideal for illustrating topics such as financial forecasting, economic growth, investment strategies, or technology in finance. Useful for presentations, articles on business trends, and financial reports.
Powered by 


downloads
Tags:
More
Credit Photo
If you would like to credit the Photo, here are some ways you can do so
Text Link
photo Link
<span class="text-link">
<span>
<a target="_blank" href=https://pikwizard.com/photo/digital-financial-data-visualization-with-increasing-graph/5595b32754af4b066b8d65598c9bc2f5/>PikWizard</a>
</span>
</span>
<span class="image-link">
<span
style="margin: 0 0 20px 0; display: inline-block; vertical-align: middle; width: 100%;"
>
<a
target="_blank"
href="https://pikwizard.com/photo/digital-financial-data-visualization-with-increasing-graph/5595b32754af4b066b8d65598c9bc2f5/"
style="text-decoration: none; font-size: 10px; margin: 0;"
>
<img src="https://pikwizard.com/pw/medium/5595b32754af4b066b8d65598c9bc2f5.jpg" style="margin: 0; width: 100%;" alt="" />
<p style="font-size: 12px; margin: 0;">PikWizard</p>
</a>
</span>
</span>
Free (free of charge)
Free for personal and commercial use.
Author: Creative Art
Similar Free Stock Images

Premium


Premium

Premium


Premium


Premium


Premium


Premium


Premium


Premium


Premium


Premium


Premium


Premium


Premium

Premium


Premium

Premium


Premium


Premium


Premium


Premium


Premium


Premium


Premium


Premium

Explore More Free Stock Images