
- Home >
- Stock Photos >
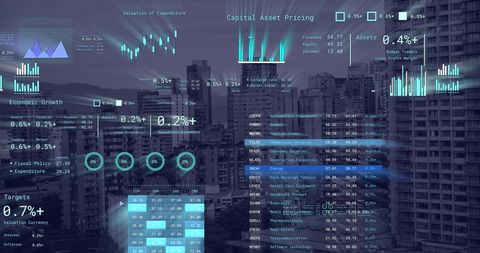
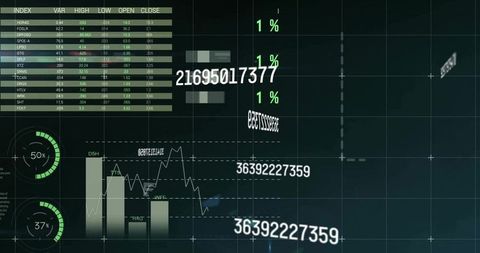
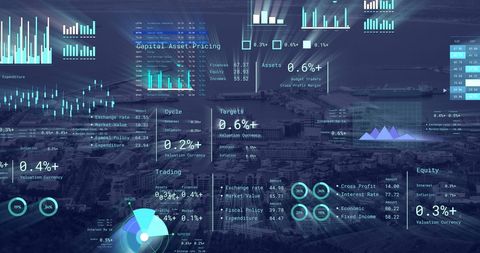
- Digital Financial Data Visualization with Infographics
Digital Financial Data Visualization with Infographics Image

Digital financial data displayed with various charts and statistical graphics fades on a dark background. Ideal for illustrating topics related to business analysis, data-driven decision making, and global financial trends. This can be used in finance presentations, digital media articles, and videos focused on economic studies and technology-enhanced data visualization.
Powered by 


downloads
Tags:
More
Credit Photo
If you would like to credit the Photo, here are some ways you can do so
Text Link
photo Link
<span class="text-link">
<span>
<a target="_blank" href=https://pikwizard.com/photo/digital-financial-data-visualization-with-infographics/4222e91f34ec0938df49c4c8ca6139bc/>PikWizard</a>
</span>
</span>
<span class="image-link">
<span
style="margin: 0 0 20px 0; display: inline-block; vertical-align: middle; width: 100%;"
>
<a
target="_blank"
href="https://pikwizard.com/photo/digital-financial-data-visualization-with-infographics/4222e91f34ec0938df49c4c8ca6139bc/"
style="text-decoration: none; font-size: 10px; margin: 0;"
>
<img src="https://pikwizard.com/pw/medium/4222e91f34ec0938df49c4c8ca6139bc.jpg" style="margin: 0; width: 100%;" alt="" />
<p style="font-size: 12px; margin: 0;">PikWizard</p>
</a>
</span>
</span>
Free (free of charge)
Free for personal and commercial use.
Author: Awesome Content
Similar Free Stock Images

Premium


Premium


Premium


Premium

Premium


Premium


Premium

Premium
Premium

Premium


Premium


Premium


Premium


Premium


Premium


Premium


Premium


Premium


Premium


Premium


Premium

Premium

Premium


Premium


Premium

Explore More Free Stock Images