- Home >
- Stock Photos >
- Digital Financial Data Visualization with Interface Graphs
Digital Financial Data Visualization with Interface Graphs Image

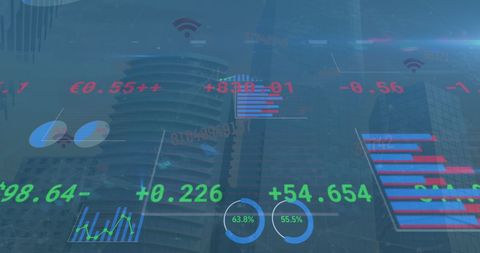
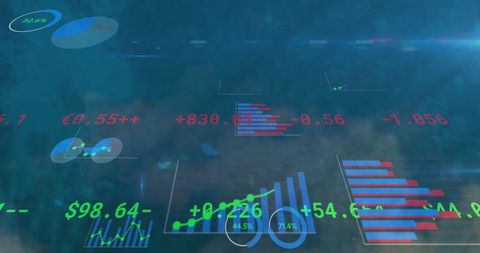
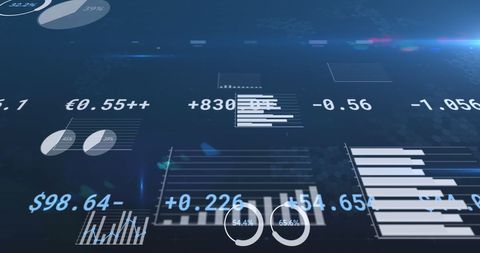
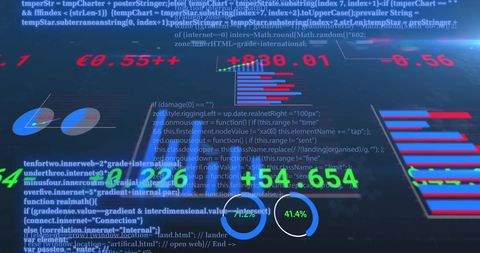
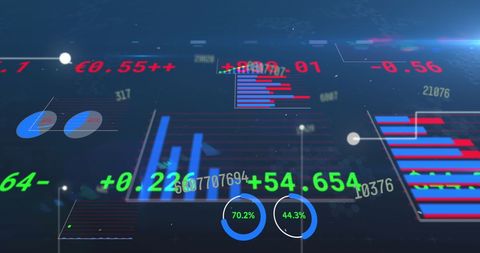
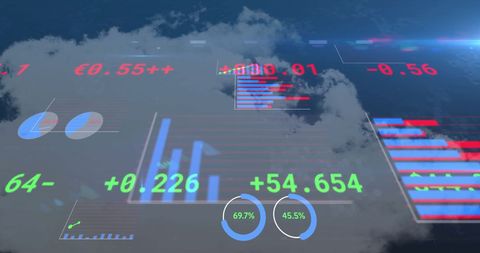
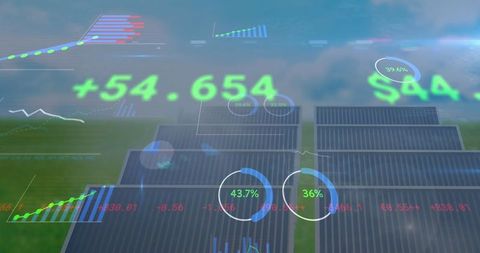
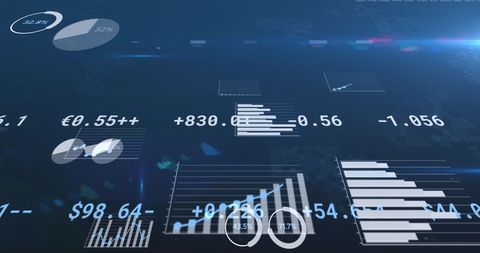
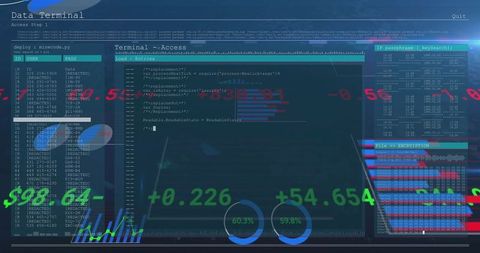
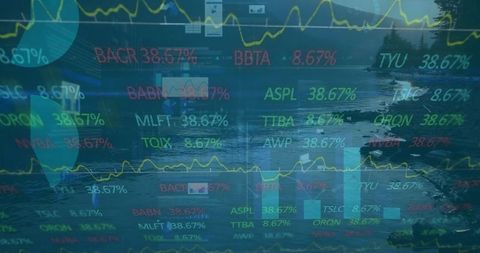
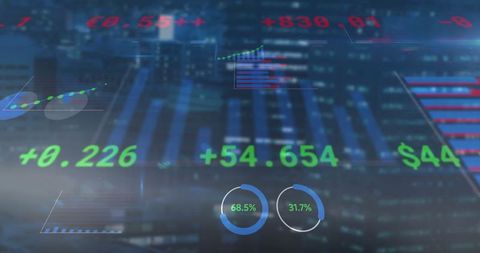
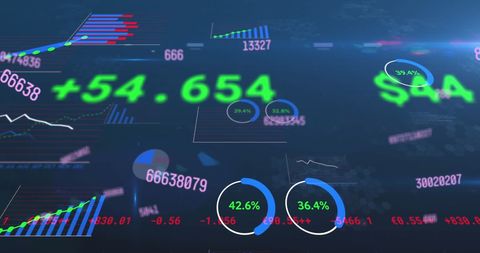
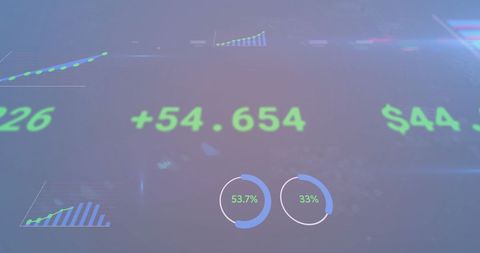
This image displays a conceptual rendering of financial data visualization with illuminated squares and charts overlaying numbers and graphs. It is ideal for use in presentations and content related to finance, technology, global markets, or economic analyses, offering a modern and high-tech aesthetic to underscore themes of innovation and data-driven decisions.

downloads
Tags:
More
Credit Photo
If you would like to credit the Photo, here are some ways you can do so
Text Link
photo Link
<span class="text-link">
<span>
<a target="_blank" href=https://pikwizard.com/photo/digital-financial-data-visualization-with-interface-graphs/e939dc90d708defefc69097459ab4d9e/>PikWizard</a>
</span>
</span>
<span class="image-link">
<span
style="margin: 0 0 20px 0; display: inline-block; vertical-align: middle; width: 100%;"
>
<a
target="_blank"
href="https://pikwizard.com/photo/digital-financial-data-visualization-with-interface-graphs/e939dc90d708defefc69097459ab4d9e/"
style="text-decoration: none; font-size: 10px; margin: 0;"
>
<img src="https://pikwizard.com/pw/medium/e939dc90d708defefc69097459ab4d9e.jpg" style="margin: 0; width: 100%;" alt="" />
<p style="font-size: 12px; margin: 0;">PikWizard</p>
</a>
</span>
</span>
Free (free of charge)
Free for personal and commercial use.
Author: Creative Art