
- Home >
- Stock Photos >
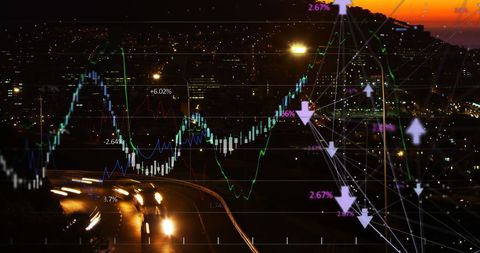
- Digital Financial Data Visualization with Neon Wave and Numeric Labels
Digital Financial Data Visualization with Neon Wave and Numeric Labels Image

AI
AI Generated Image. This image illustrates a digital financial dashboard featuring a dynamic neon waveform complemented by numeric labels, creating a futuristic and technological atmosphere. It highlights the complexity and innovation in data analytics, making it ideal for financial magazines, tech blogs, or presentations focusing on the intersection of finance and technology. The neon colors and digital setting evoke a sense of advanced analytics and cyber advancements.
Powered by  - Get 15% off with code: PIKWIZARD15


downloads
Tags:
More
Credit Photo
If you would like to credit the Photo, here are some ways you can do so
Text Link
photo Link
<span class="text-link">
<span>
<a target="_blank" href=https://pikwizard.com/photo/digital-financial-data-visualization-with-neon-wave-and-numeric-labels/2ae96dc325521d1d6b05edf064d8328a/>PikWizard</a>
</span>
</span>
<span class="image-link">
<span
style="margin: 0 0 20px 0; display: inline-block; vertical-align: middle; width: 100%;"
>
<a
target="_blank"
href="https://pikwizard.com/photo/digital-financial-data-visualization-with-neon-wave-and-numeric-labels/2ae96dc325521d1d6b05edf064d8328a/"
style="text-decoration: none; font-size: 10px; margin: 0;"
>
<img src="https://pikwizard.com/pw/medium/2ae96dc325521d1d6b05edf064d8328a.jpg" style="margin: 0; width: 100%;" alt="" />
<p style="font-size: 12px; margin: 0;">PikWizard</p>
</a>
</span>
</span>
Free (free of charge)
Free for personal and commercial use.
Author: AI Creator
Similar Free Stock Images

Premium


Premium


AI

AI

AI

Premium


AI


Premium

AI

AI


AI

Premium


AI


AI


AI


Premium


AI


Premium


AI

Premium

AI


Premium


AI

AI

AI

Premium


Premium

Premium


Premium

AI

AI


Premium


Premium

Premium


AI


Premium


Premium

AI


AI

AI


AI

Premium


Premium

AI


AI


AI


Premium

Premium


AI


Premium

Premium


AI

Premium

Explore More Free Stock Images