- Home >
- Stock Photos >
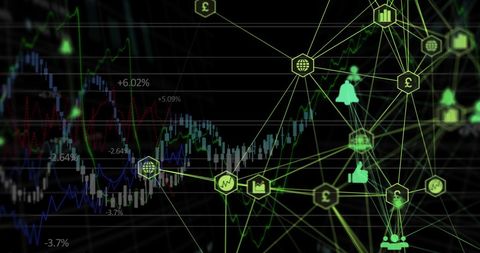
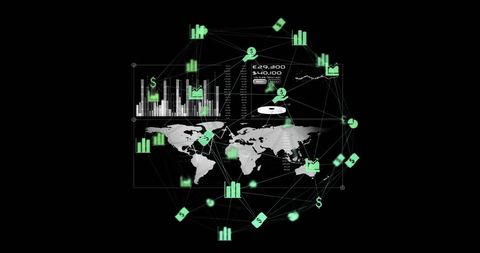
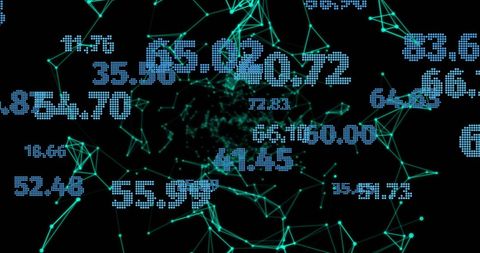
- Digital Financial Data Visualization with Network Graphs
Digital Financial Data Visualization with Network Graphs Image

Abstract representation of digital financial data visualized through network graphs and statistics. Ideal for illustrating concepts in financial technology, data analysis, economic trends, and network systems. Useful in presentations about digital data handling, financial analytics, or internet business infrastructure.

Credit Photo
If you would like to credit the Photo, here are some ways you can do so
Text Link
photo Link
<span class="text-link">
<span>
<a target="_blank" href=https://pikwizard.com/photo/digital-financial-data-visualization-with-network-graphs/2278d5e88d2b8f347a49625d3f08fa20/>PikWizard</a>
</span>
</span>
<span class="image-link">
<span
style="margin: 0 0 20px 0; display: inline-block; vertical-align: middle; width: 100%;"
>
<a
target="_blank"
href="https://pikwizard.com/photo/digital-financial-data-visualization-with-network-graphs/2278d5e88d2b8f347a49625d3f08fa20/"
style="text-decoration: none; font-size: 10px; margin: 0;"
>
<img src="https://pikwizard.com/pw/medium/2278d5e88d2b8f347a49625d3f08fa20.jpg" style="margin: 0; width: 100%;" alt="" />
<p style="font-size: 12px; margin: 0;">PikWizard</p>
</a>
</span>
</span>
Free (free of charge)
Free for personal and commercial use.
Author: Authentic Images