1. Home > 
  2. Stock Photos > 
  3. Digital Financial Data Visualization with Rising Graph Against Grid Background

Digital Financial Data Visualization with Rising Graph Against Grid Background Image

Digital Financial Data Visualization with Rising Graph Against Grid Background

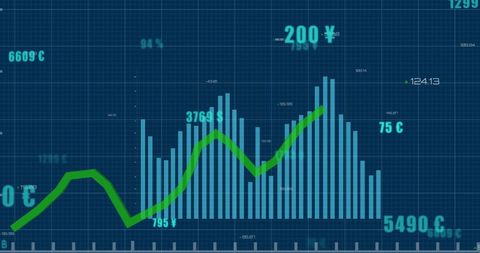
This visual digitizes financial data against a dark grid background with highlighted currency symbols and a rising green graph waveform. Suitable for financial reports, web design related to fintech, economic analysis presentations, and business-focused content discussing stock market trends and global financial systems.

Powered by Adobe logo
Financial data graph with rising and falling trends in vibrant colors - Powered by AdobeTwo professional analyzing financial data graphs, charts on laptop display at a modern workspace. Financial analysis or business evaluation concept - Powered by AdobeAI finance business data analysis digital technology investment trading market stock, financial analyst using advanced holographic interface for global market insight, smart investment strategy - Powered by AdobeAn analyst uses a computer and dashboard for data business analysis and Data Management System with KPI and metrics connected to the database for technology finance, operations, sales, marketing  - Powered by Adobe
Dynamic blue and green digital stock market graph with bar charts and lines on a dark background, representing financial data analysis, investment trends, business growth, and global economy fluctuat - Powered by Adobe

Credit Photo

If you would like to credit the Photo, here are some ways you can do so

Free (free of charge)

Free for personal and commercial use.

Author: Creative Art

Similar Free Stock Images

Green Data Graph on Black Digital Interface
Premium
Abstract image depicting financial data overlaid on a blurred cityscape background, suggesting the dynamism of urban markets and global finance
Fluctuating Financial Graph on Digital Orange Background
Financial Data Analysis with Digital Graph Overlay
Premium
Abstract representation of financial growth with glowing graphs and data patterns in dark background
Dynamic Financial Data Analysis with Virtual Screen
Financial Graph Showing Indices Trends on Blue Background
Digital Data Processing Interface with Code and Graph
Digital Green Line Graph Over Grid with Statistics and Numbers
Digital Financial Data and Multicurrency Exchange Charts
Dynamic Financial Data on Dark Background With Colorful Graphs
Digital Data Analysis with Green Line Graph on Grid Background
Premium
Dynamic digital financial graph with glowing purple and blue trend lines on dark background displaying market analytics data for investment technology
Green Line Graph on Dark Digital Grid
Dynamic Financial Graphs Illustrating Market Trends
Financial Data Visualization with Line and Bar Graphs
Digital Data Analysis with Security Threat Warning
Premium
A glowing financial chart with data analytics on a digital world map background.
Declining Financial Market Chart Over Grid Background
Green Line Graph with Data Points on Grid Background
Digital Finance Art with Graphs and Currency Symbols Overlapping
Dynamic Stock Market Data with Fluctuating Graph
Premium
Business, finance and investment concept. Business man analyzing and calculating tax, interest rate, financial data with economic graph growth chart, strategy and budget planning.
Futuristic Financial Data Visualization with Graph
Fluctuating Financial Graph With Data Visualization
Pixelated Stacked Gold Coin Column with Green Line Graph on Dark Financial Grid Dashboard
Financial Graph and Cityscape Analysis with Technological Overlay
Futuristic Data Trend Graphs on Digital Interface
Premium
Close-up of a soccer ball on green grass with sports data displayed, illuminating the night scene. Concept for sports betting strategy, financial analysis and market trends
Premium
Business audit stock financial finance management on analysis data strategy with graph accounting marketing or report chart economy investment research profit concept
Data Analysis Process with Green Digital Interface
Financial Data Visualization with Global Network Elements
Digital Financial Analysis with Infographic and Data Flow
Fluctuating Financial Graph on Green Grid Background
Red Line Graph Over Histogram Representing Financial Volatility
Financial Data Chart Over City Silhouette
Digital Interface Displaying Volatile Financial Market Analysis
Futuristic Financial Graph with Binary Code Overlay
Dynamic Financial Data Representation on Digital Grid
Financial Data Analysis with Trend Line and Statistics
Digital Cityscape with Modern Vertical Patterns
Digital Data Visualization with Graphs on Gradient Background
Premium
A dynamic team collaborates in a modern office setting with digital interfaces displaying financial graphs and analytics, emphasizing strategic growth and innovative ideas. Scalp
Digital Financial Data Interfaces in Global Connection
Global Financial Data and Graph Analysis Technology
Digital Data Analysis Against Abstract Cityscape
Financial Growth Trends Over Cityscape Background
Premium
A robotic hand interacting with a glowing holographic bar chart emerging from a digital tablet, symbolizing AI-driven data analysis, business intelligence, and futuristic technology.
Digital Financial Data and Global Market Analysis on Graph
Dynamic Financial Data Visualization over Urban Silhouette
Financial Data Line Graph on Digital Display
Bright Green Sales Statistics on Futuristic Grid Display
Premium
Representation of data analytics,charts, graphs and data driven insights emerging from a sea of information
Global Financial Decline Chart with Red Trend Line
Sharp Decline in Stock Market Graph Against Red Financial Data Background
Abstract Digital Finance Background with Graphs and Data Visualization
Analyzing Growing Graph Line on Purple Gradient Background
Premium
Stock market investment trading graph growth.Trade business analytics graph and financial chart.Finance chart,stock market business and exchange financial growth graph.
Green Financial Line Graph with Candlestick Data on Grid Background
Falling Stock Market Data with Red Line Indicator
Futuristic Graph and Data Visualization Interface Design
Declining Stock Market Graph with Red Trend Line
Premium
Hand in navy suit draws a glowing upward arrow labeled 'SALES' on a digital screen, symbolizing business growth and financial success. Focus on concept and growth.
Diverse Graphical Data on Digital Financial Interface Concept
Rising Green Line Chart Overlays Concept of Financial Growth
Premium
Magnifying glass is on a black background with a red and blue line
Digital Analytics Interface with Vibrant Data Display
Abstract Digital Data with Upward Trending Line Graph
Financial Growth Bar and Line Graph on Digital Background
Premium
Businessman working with modern computer virtual dashboard analyzing finance sales data and economic growth graph chart and block chain technology.
Interactive Business Graph with Currency Data and Analytics
Premium
Analyst working in Business Analytics and Data Management System to make report with KPI and metrics connected to database. Corporate strategy for finance, operations, sales, marketing.
Premium
Analyzing real-time financial market trends and stock performance with vibrant candlestick charts and data displayed on a digital screen, symbolizing investment analysis and global economic activity
Dynamic Financial Chart with Red Line Graph on Digital Interface
Financial Data Analysis with Interactive Graphs
Global Data Processing with Dynamic Graph Visualization
Financial Chart with Dynamic Numbers on Grid Background
Premium
Dynamic financial chart overlaying stunning cityscape at night, symbolizing growth and opportunity in the modern business world with vibrant colors
Fluctuating Digital Stock Market Data Chart
Green Financial Line Chart Over Modern Office Buildings
Green Line Chart with Financial Data on Digital Display
Digital DNA and Data Analytics Fusion Visualization
Premium
financial chart with stock market graph and silhouette people walking in office with cityscape blurred background
Financial Data Analytics Overlaying Digital World Map Background
Financial Data Analysis with Declining Trend on Blueprint Graph
Graphical Analysis on Russian Economy with Financial Metrics
Premium
Financial data charts with glowing stock and forex graphs on a dark background illuminated in blue tones. 3D Rendering
Digital Grid Interface with Data Points for Business Analysis
Digital Financial Data Analytics and Economic Trends
Digital Currency Trading Interface with Data Visualization
Premium
Manager touches growth graph on analytics dashboard. Business data analysis reports with marketing finance management strategy. Digital charts graphs increase business performance, sales statistic
Cityscape with Vertical Columns on Black Background
Dynamic Stock Market Data Display in Red and Green Ticker
Analyzing Data Trends on Digital Graph Interface
Business Data Technology Concept with Grid Overlay
Financial Data Charts with World Map on Blue Digital Background
Digital Financial Chart with Green Trend Line on Grid Background
Premium
Transparent or png stock market investment trading graph growth.Trade business analytics graph and financial chart.
Digital Data Visualization on Grid Display
Binary Code and Financial Data on Digital Screen
Economic Trends Analysis with Financial Indicators and Graphs
Premium
Green arrow pointing upward on financial graph. Business growth chart with rising trend line. Digital stock market data visualization for investment analysis
Digital Abstract Graph Showing Financial Growth and Currency Analysis
Declining Graph with 49% Reduction on Dark Digital Background
Dynamic Green Line Graph Showing Financial Data Fluctuations
Rising Graph Line on Digital Green Grid Background
Cityscape Enhances Financial Data Visualization Digital Concept
Premium
Data analytics and big data strategy for real-time analytics, predictive data modeling, business intelligence analytics, and data-driven decision-making in modern digital businesses. Thunk
Futuristic Data Processing Interface with Dynamic Graphs
Digital Financial Report Analysis Overlaid on Office Scene
Dynamic Red Line Graph With Data Points on Gridded Background
Digital Urban Cityscape with Abstract Sound Waves
Premium
Business finance data analytics graph.Financial management technology.Advisor using KPI Dashboard on virtual screen.
Digital Interface with Data Processing Visualization
Dynamic Financial Stock Market Analysis Display
Digital Financial Graphs and Stock Market Data Visualization
Abstract Digital Graph with Data Points and Grid
Financial Graph Over Cityscape Depicting Data Trends and Analytics
Premium
Glowing pink neon arrow graph showing upward financial growth and success
Financial Data Analysis in Digital Interface with Graphs
Binary Code Financial Analytics with Rising Graph Line
Fluctuating Stock Market Graph with Symbols and Percentages
Digital Data Processing Interface with Green Growth Chart
Dynamic Digital Stock Market Chart with Growing Financial Trends
Financial Growth Chart with Dynamic Green Line on Grid Overlay
Explore More Free Stock Images