1. Home > 
  2. Stock Photos > 
  3. Digital Financial Data Visualizations on Blue Interface

Digital Financial Data Visualizations on Blue Interface Image

Digital Financial Data Visualizations on Blue Interface

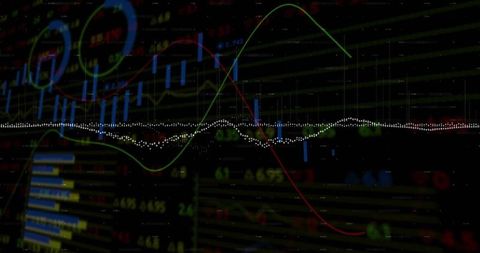
This dynamic representation of financial and stock market data against a digital blue background is ideal for presentations on economic trends and financial analysis. It can be used in reports, articles, and websites related to finance, global business, and digital data processing.

Powered by Adobe logo
A robotic hand showcases stock market data with ascending graphs and vibrant colors, symbolizing advancement in technology and finance, representing future possibilities. Copula - Powered by AdobeFuturistic data center managing big data and financial market analytics - Powered by AdobeBlue-toned image with a circuit diagram overlaying a stock market graph, indicating technological data - Powered by AdobeSales data analysis dashboard showing performance, trends, and insights. Sales data tracks growth, supports decisions, sales data boosts strategy, and sales data drives performance. - Powered by AdobeArtificial intelligence chip analyzes market data with glowing energy and candlestick charts, symbolizing future finance. - Powered by Adobe

Credit Photo

If you would like to credit the Photo, here are some ways you can do so

Free (free of charge)

Free for personal and commercial use.

Author: People Creations

Similar Free Stock Images

Dynamic Financial Data Analyzing with Graph Overlays
Premium
Abstract financial data stream background with dynamic digital information display
Inflation Graph with Data Code Overlay on Digital Screen
Premium
Digital blue stock market analysis graph showing fluctuation and data processing on screen display.
Tech Growth Analysis with Dynamic Data Visualization
Colorful Financial Graph with Digital Technology Concept
Digital Analysis of Financial Data with Dynamic Graphs
Market dashboard visualizing neon candlesticks, histogram bars and HUD rings for trading
Dynamic Stock Market Visual in Modern Office Setting
Neon Candlestick and Teal Bar Charts Over Digital Globe for Global Trading Visualization
Financial Chart Analysis with Digital Grid Interface
Inflation Impact with Graphs and Data Overlays in Green
Premium
The illustration shows a futuristic digital financial system with glowing displays, microchips, and stacks of currency, representing digital transactions and data processing.
Premium
Futuristic digital business growth chart with glowing blue arrow and icons for time management process optimization and financial data analysis on a dark technology background
Digital Financial Market Chart Visualization on Trading Screen
Dynamic Digital Market Analysis with Holographic Data
Vibrant Financial Candlestick Chart with Trend Lines
Premium
Utility Bills to Stock Assets Transformation Concept with Digital Funnel and Graphs process smart utilities
Premium
Bitcoin coin symbolizing digital currency and blockchain technology on an electronic motherboard
Abstract Financial Data Visualization in Digital Interface
Dynamic Stock Market Graphs Over Digital Interface
Premium
Futuristic data visualization showing financial market trend with dynamic glowing lines
Futuristic Data Dashboard with Colorful Line Graphs
Abstract Data Visualization with Dynamic Charts and Graphs
Dynamic Bar Graph Display of Financial Data Trends
Global Business Finance Data Analysis Visualization
Premium
Financial data charts and graphs showcasing market analysis and business analytics
Market Analysis Visualization Showing Candlestick Chart with Teal Volume Bars and Radial Grid
Dynamic Financial Graph on Digital Background
Digitally Processed Global Business Data Visual on Blue Background
Dynamic Financial Data Graph on Blue Digital Background
Premium
Robotic hand analyzing rising financial chart with glowing data spikes on digital interface, symbolizing futuristic AI-driven market technology concept. Ai generative
Futuristic Stock Market Data Visualization with Graphs
Business Team Collaborating on Financial Data Analytics in Office
Dynamic Forex Trading Graphs with Increasing Numbers
Futuristic Digital Interface with Dynamic Financial Graph
Abstract Digital Financial Chart on Blue Interface
Analyzing Financial Charts on Digital Screen
Premium
In depth analysis of stock market data  the role of financial technology in modern trading
Premium
Server room showing financial data processing and global network
Premium
A holographic bar chart of financial data emerging from a futuristic black device on a dark background
Digital Data Analysis and Visualization with Line Graph
Dynamic Financial Data Chart with Rising Bars and Trend Lines
Digital Display of Stock Market Data with Rising Trends
Digital Financial Data Analytics Overlay in Modern Office
Dynamic Stock Market Analytics Display on Blue Background
Dynamic Financial Data Display with Market Trends
Colorful Data Chart Over Blue Background
Financial Data Analysis with Dynamic Graph on Blue Background
Global Financial Trends on Digital World Map Display
Futuristic Digital Data Analytics Visual Interface
AI
Colorful Financial Data Display on Digital Screen for Trading and Analytics
Financial Data Visualization Over Futuristic Cityscape
Dynamic Financial Data Analytics with Charts and Graphs
Premium
A futuristic robot stands against a backdrop of vibrant, digital stock market data, symbolizing advanced technology and AI in finance.
Real-Time Financial Data Analysis with Graphs and Charts
Digital Fintech Interface with Global Business Network
Dynamic Stock Market Chart Showing Fluctuating Financial Data
Financial Data Analysis with Abstract Chart Grid Overlay
Premium
Remote Check Banking Transaction on Digital Grid Background
Abstract Data Graph with Dynamic Charts and Indicators
Candlestick Chart Illustrating Financial Trends and Analytics
Digital Financial Data Processing with Graphs and Charts
Dynamic Financial Data Chart Display with Graphical Analysis
Premium
Artificial intelligence chip enables fast data transmission and energy trading using advanced technology for efficient processing
Financial Data Analysis Vibrant Graphs on Blue Background
Premium
Abstract blue illustration of financial data charting with connected lines, dark background
Global Financial Data Analysis with World Map Visualization
Abstract Financial Stock Market Graph Overlay on Digital Interface
Dynamic Stock Market Data Visualization on Digital Screen
Graphical Data Analysis on Digital Interface
Premium
Machine learning finance performance metrics gear data technology cog concept analytics economy gently gear digital stock market chart background
Dynamic Data Visualization and Financial Growth Curves
Dynamic Financial Data with Overlaid Cityscape Interface
Financial Data Visualization on Blue Background
Abstract Financial Data Processing and Analysis Interface
Premium
Magnified fingerprint on financial data
Dynamic Financial Data View with Stock Market Trends and Graphs
Digital Financial Data and Stock Market Charts
Financial Data Overlaid on Empty Warehouse Illustrating Market Dynamics
Dynamic Digital Soundwave Pattern on Dark Background
Premium
A close-up view of hands on a keyboard with stock market charts displayed, showcasing upward trends in finance and investment analysis, representing market growth. Copula
Financial Data Analysis with Declining Trends
Digital Financial Data Trends and Analytics Conceptual Background
Premium
Digital Currency Concept with Dollar Symbol on Technology Background and Payment Processing Theme
Financial Market Data with Stock Candlestick Chart and Indicators
Data Visualization on Blue Digital Interface
Financial Data Display with Candlesticks and Trend Lines on Digital Dashboard
Data Security with Tech Bar Graph Overlay
Premium
Business growth concept with rising arrow and gear icons showing teamwork and process efficiency.
Global Stock Market Data Visualization on Digital Map Background
Dynamic Digital Financial Data Chart Visualization
Dynamic Stock Market Data Analysis With Graphs and Percentages
Financial Data Display with Dynamic Digital Graph
Dynamic Stock Market Chart with Fluctuating Trends and Data Points
Dynamic Stock Market Graph with Fluctuating Data Bars
Abstract Digital Financial Chart on Blue Background
Analyzing Stock Market Trends with Candlestick Chart and Data Visualization
Dynamic Stocks and Trading Data Visualization
Upward Stock Market Arrow with Binary Code Background
Financial Data Analyzing with Blue Digital Interface Background
Futuristic Digital Data Analysis Visual with Line Graphs
Dynamic Stock Market Data on Digital Interface
Dynamic Stock Market Graph Displaying Surging Growth
Premium
Artificial intelligence and technology. Keyboard key with AI symbol overlaid with US flag and stock market graphics, representing innovation, digital economy, and AI development in America.
Dynamic Stock Market Graph Showing Investment Trends
Financial Data Processing Visualization with Green Digital Grid
Dynamic Financial Stock Market Display with Analytical Data
Digital Data Visualization with Global Financial Trends
Premium
Dollar sign on processing chip representing digital finance
Dynamic Stock Market Data on Black Background
Digital Data and Financial Charts on White Background
Financial Data Processing Visualization with Colorful Bar Charts
Data Visualization on Digital Grid with Technological Interface
Digital Data Visualization Over Cityscape With Glowing Green Charts
Financial Data with Molecular Background Concept
Data Analysis Graphics on Digital Grid Background
Financial Graphs Over Candlestick Chart Indicating Stock Fluctuations
Premium
Abstract digital data visualization of a glowing financial market chart
Dynamic Trading Graph with Binary Coding Overlay
Colorful Stock Market Data with Infographics
Dynamic Financial Data Analysis with Market Charts
Dynamic Analysis of Stock Market Trends and Patterns
Premium
Image of diagrams and data processing over stock market
Dynamic Data Analysis over Virtual Grid with Neural Patterns
Explore More Free Stock Images