
- Home >
- Stock Photos >
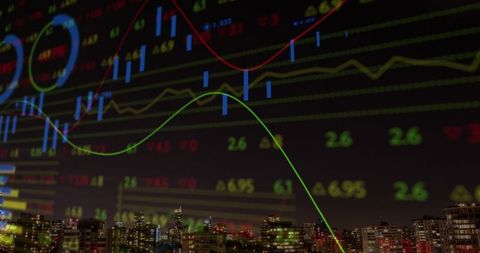
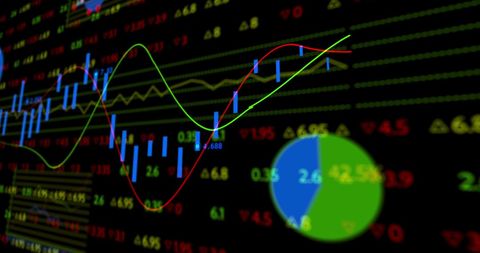
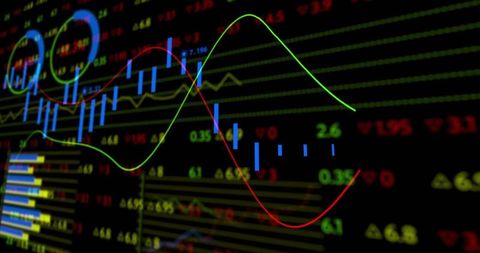
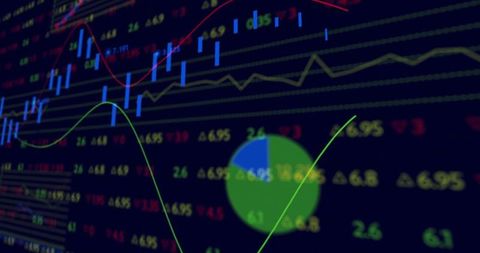
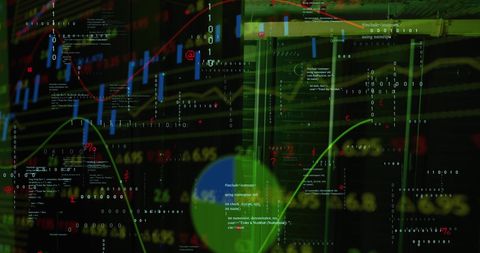
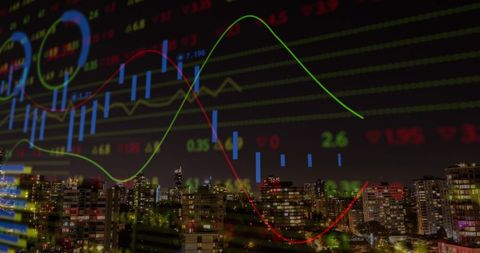
- Digital Financial Data Visualizations on Dark Background
Digital Financial Data Visualizations on Dark Background Image

Bright digital lines and numbers showcasing fluctuating financial data on a dark screen are suitable for illustrating articles on stock market trends, economic analyses, or technology in finances. This image perfect for presentations about financial technology or advertisements of data-driven services.
Powered by 


downloads
Tags:
More
Credit Photo
If you would like to credit the Photo, here are some ways you can do so
Text Link
photo Link
<span class="text-link">
<span>
<a target="_blank" href=https://pikwizard.com/photo/digital-financial-data-visualizations-on-dark-background/e4fe21e98712e8c28e9cf91983da9abe/>PikWizard</a>
</span>
</span>
<span class="image-link">
<span
style="margin: 0 0 20px 0; display: inline-block; vertical-align: middle; width: 100%;"
>
<a
target="_blank"
href="https://pikwizard.com/photo/digital-financial-data-visualizations-on-dark-background/e4fe21e98712e8c28e9cf91983da9abe/"
style="text-decoration: none; font-size: 10px; margin: 0;"
>
<img src="https://pikwizard.com/pw/medium/e4fe21e98712e8c28e9cf91983da9abe.jpg" style="margin: 0; width: 100%;" alt="" />
<p style="font-size: 12px; margin: 0;">PikWizard</p>
</a>
</span>
</span>
Free (free of charge)
Free for personal and commercial use.
Author: Authentic Images
Similar Free Stock Images

Premium

Premium

Premium


Premium


Premium


Premium


Premium


Premium

Premium

Premium


Premium


Premium


Premium


Premium


Premium


Premium


Premium


Premium

Premium

Premium


Premium


Premium


Premium


Premium


Premium


Explore More Free Stock Images