
- Home >
- Stock Photos >
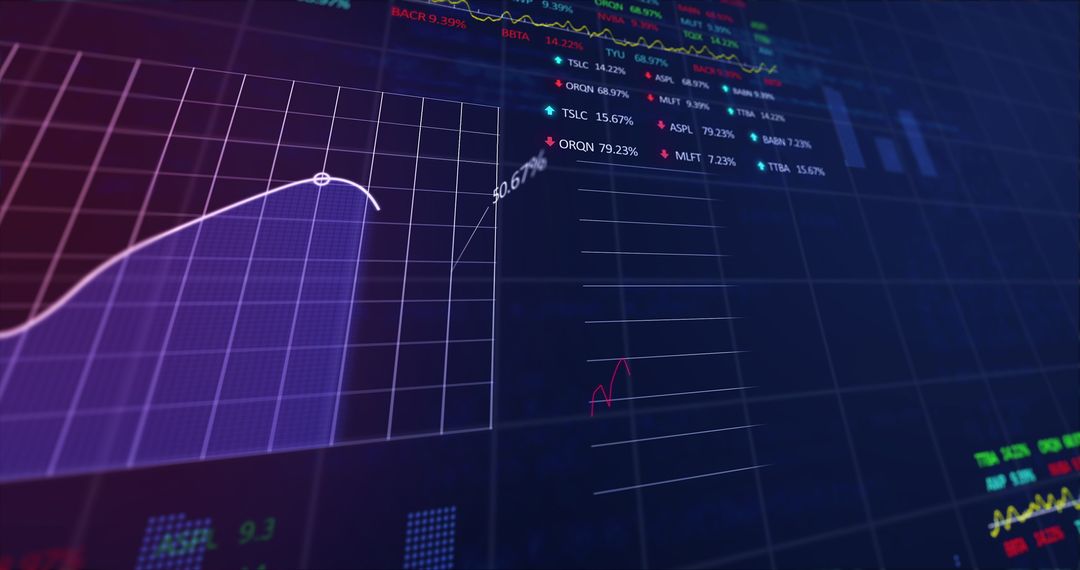
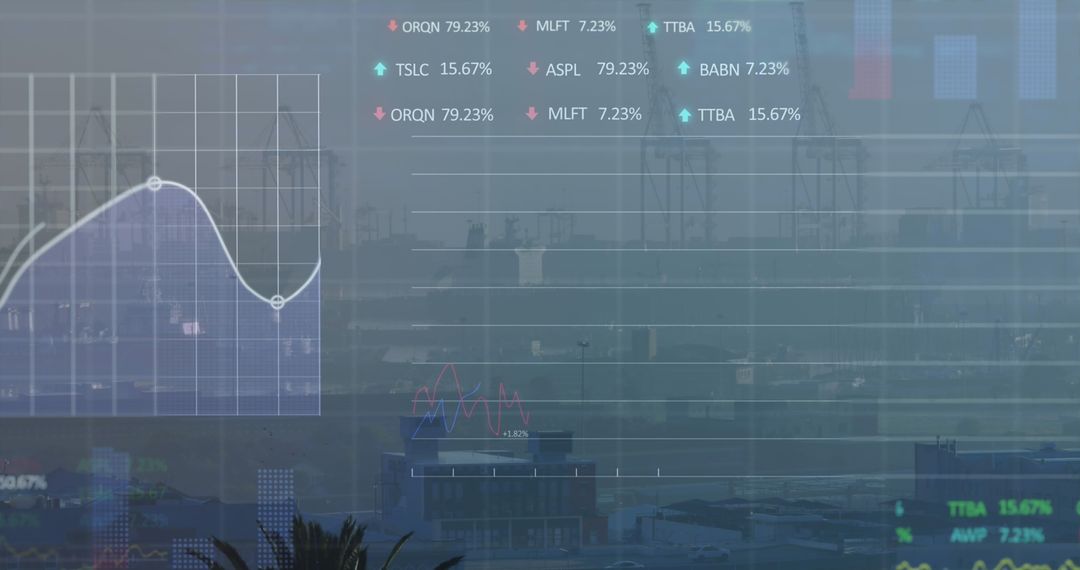
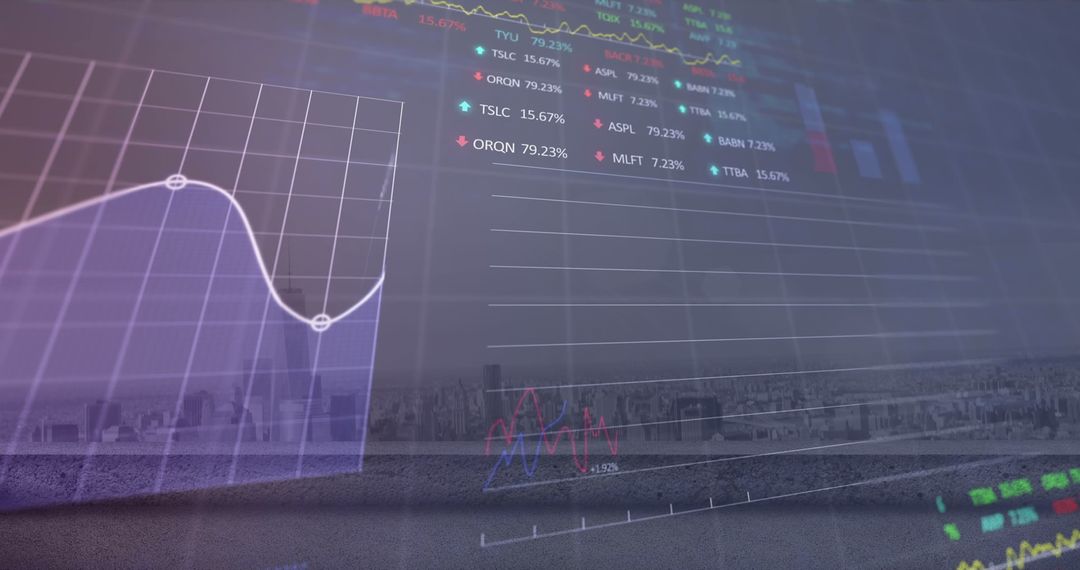
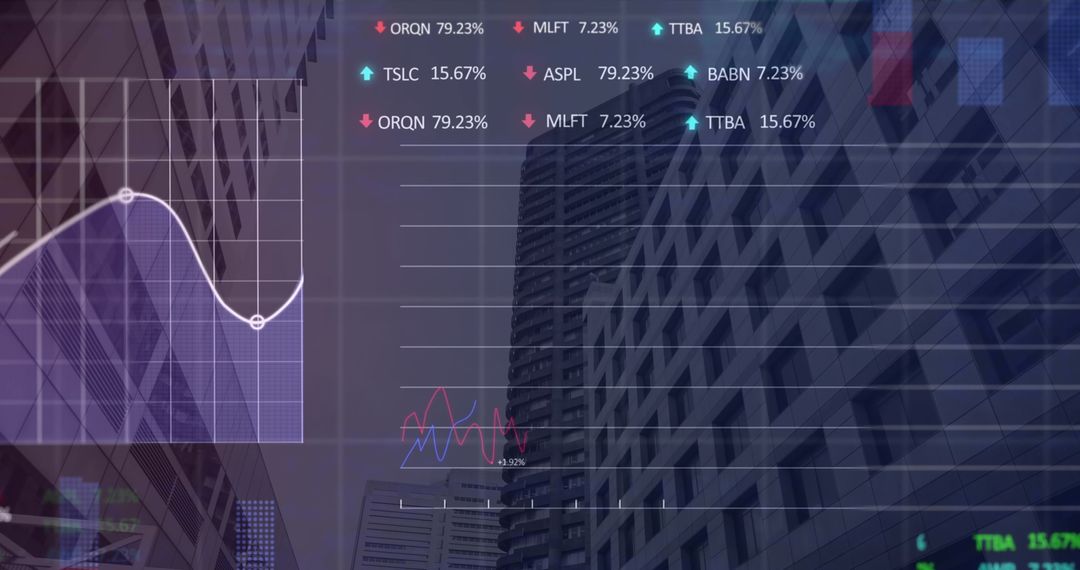
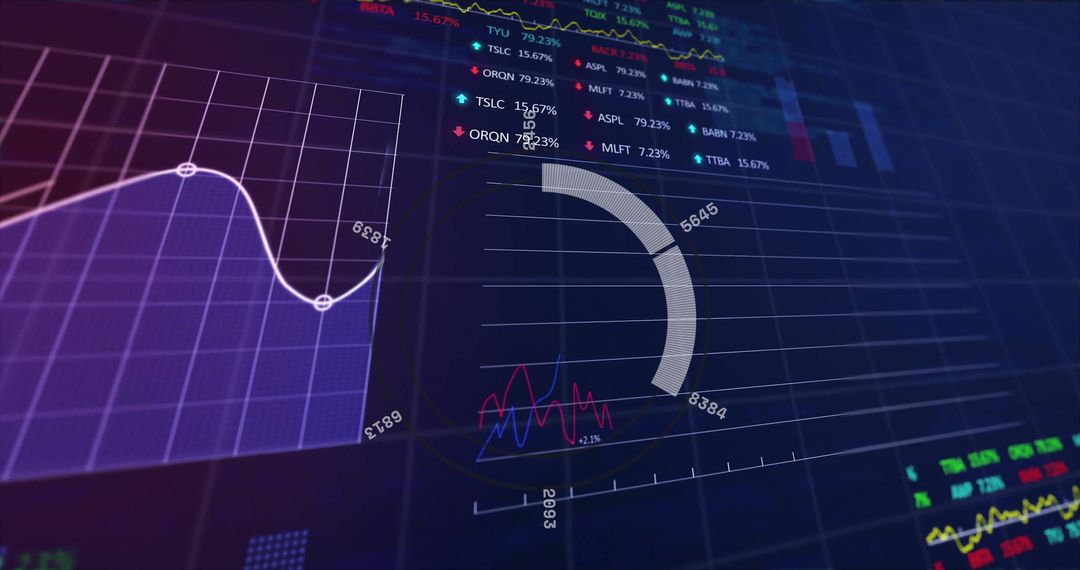
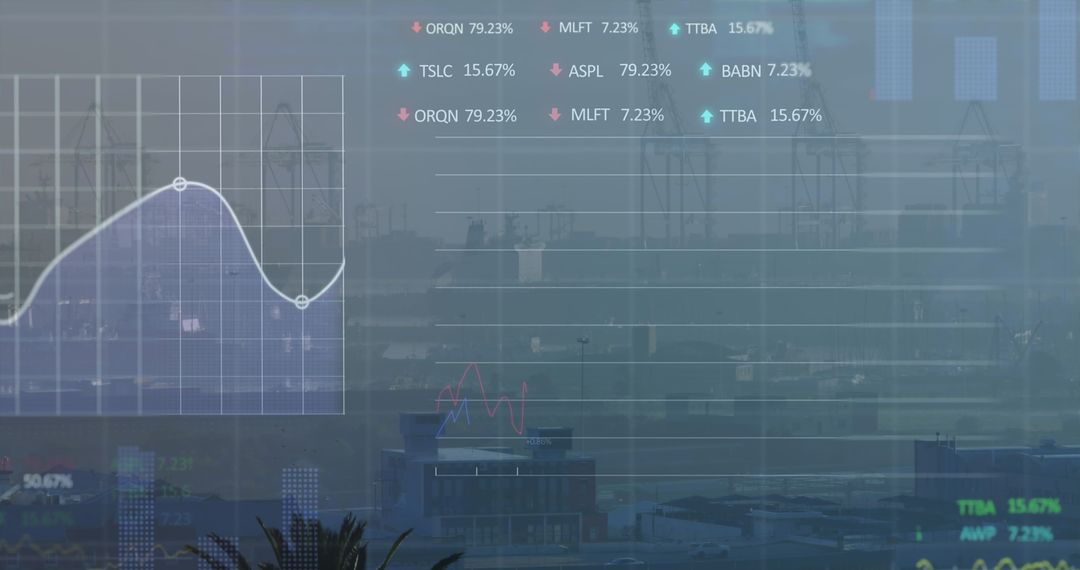
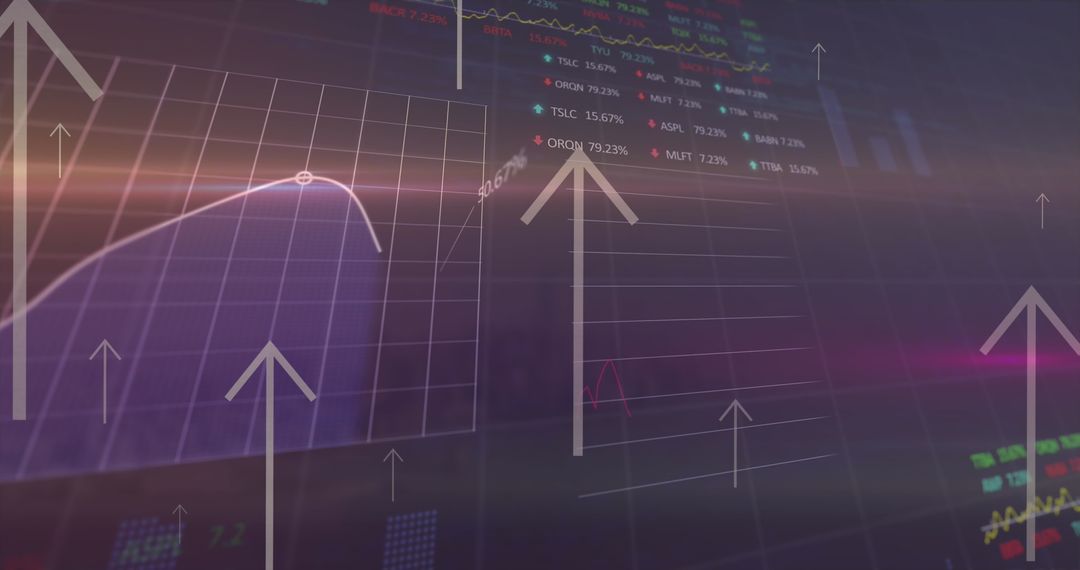
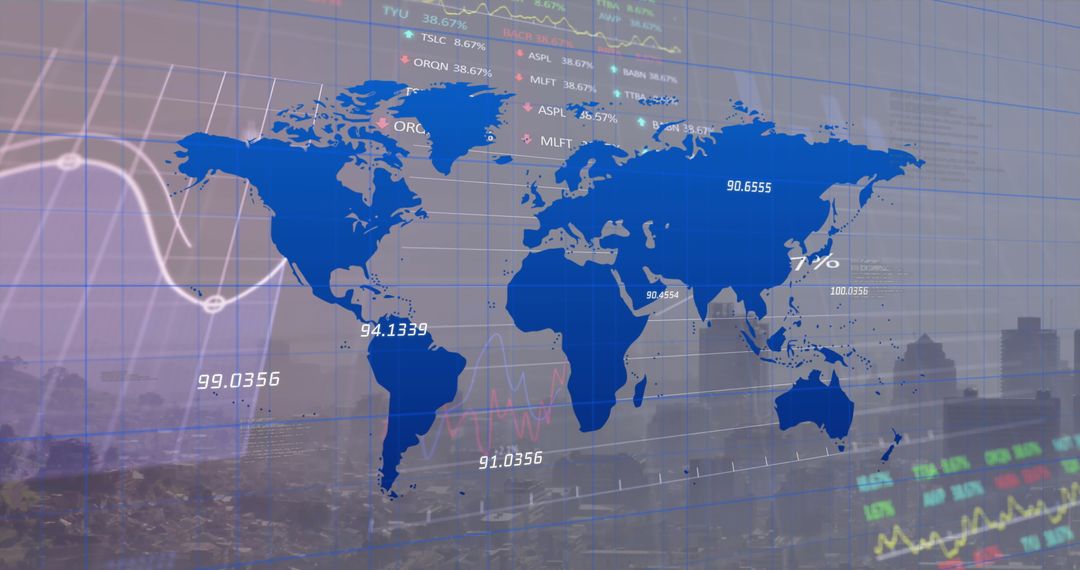
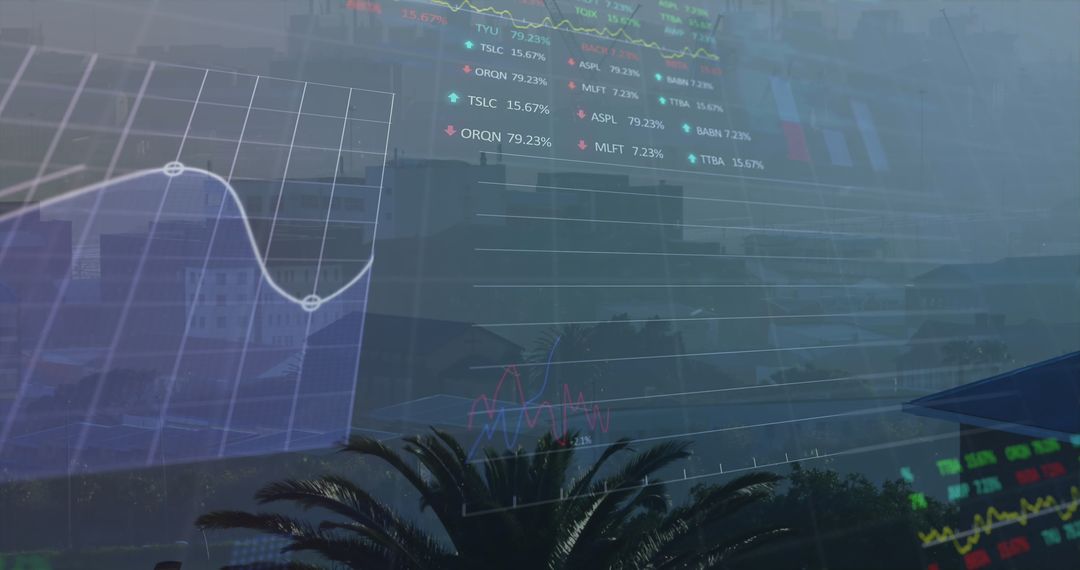
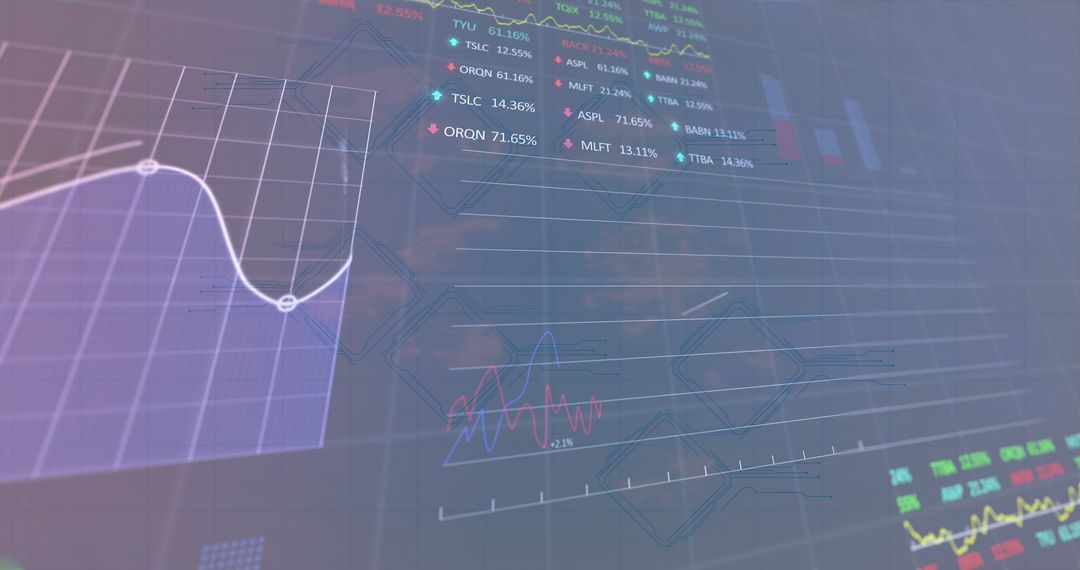
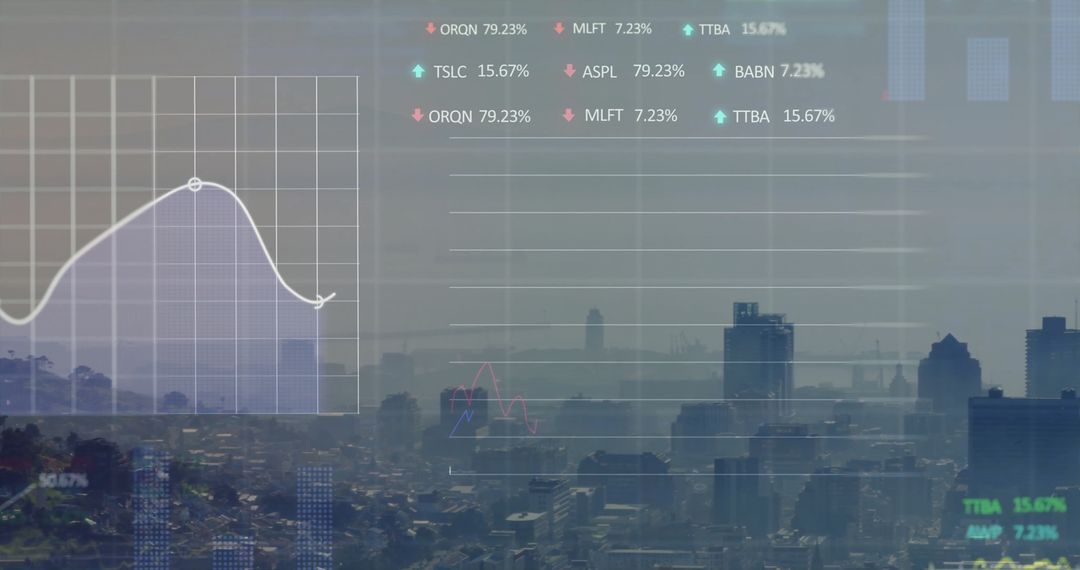
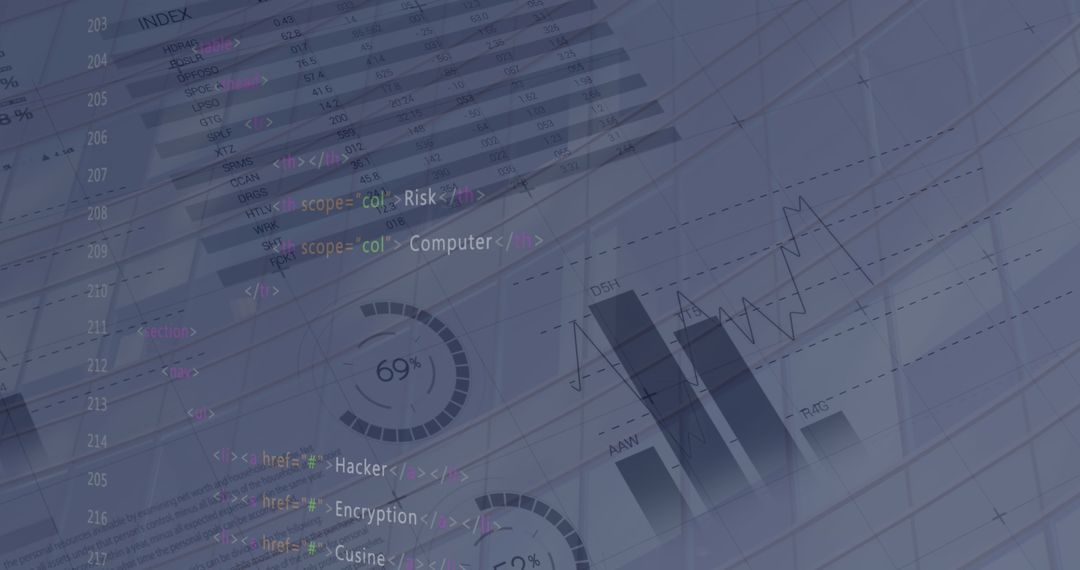
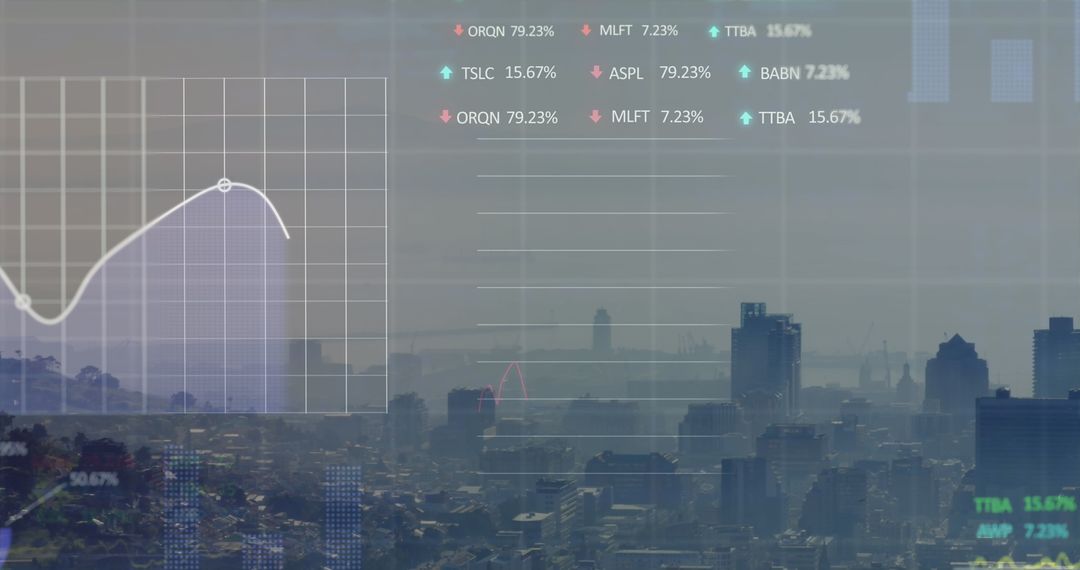
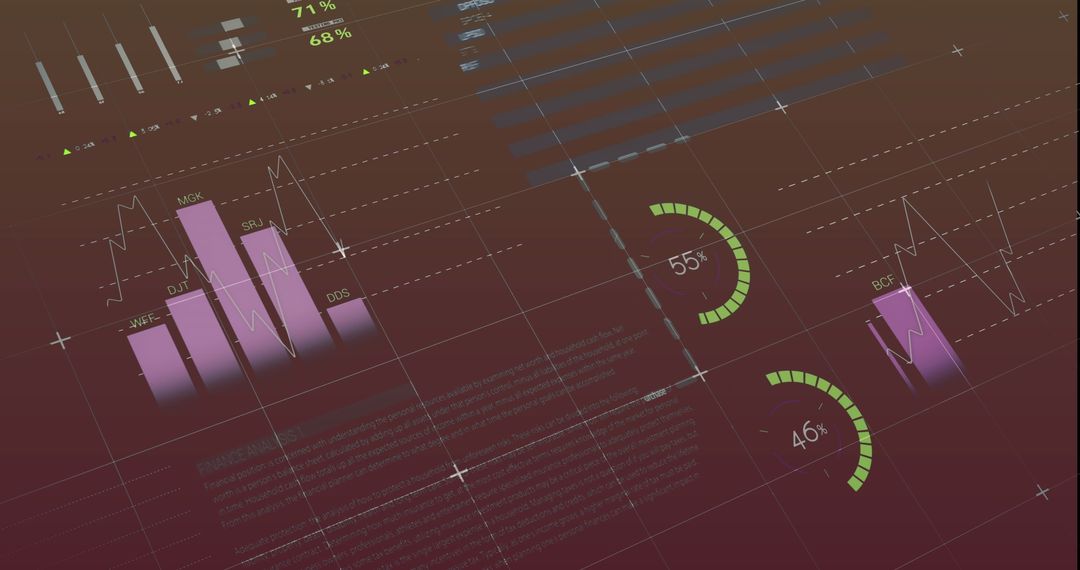
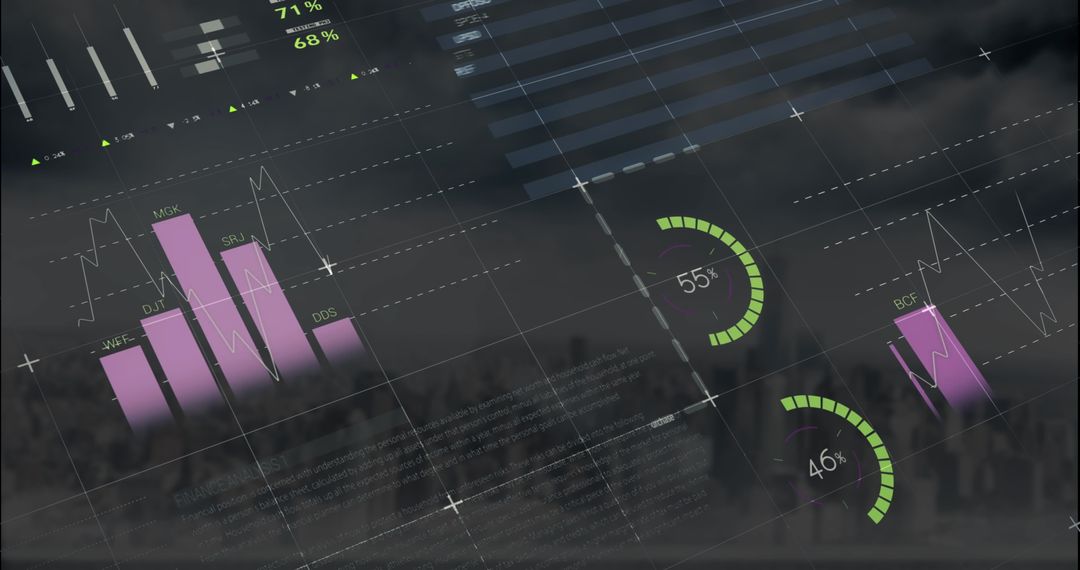
- Digital Financial Data with Business Charts Revealing Economic Trends
Digital Financial Data with Business Charts Revealing Economic Trends Image

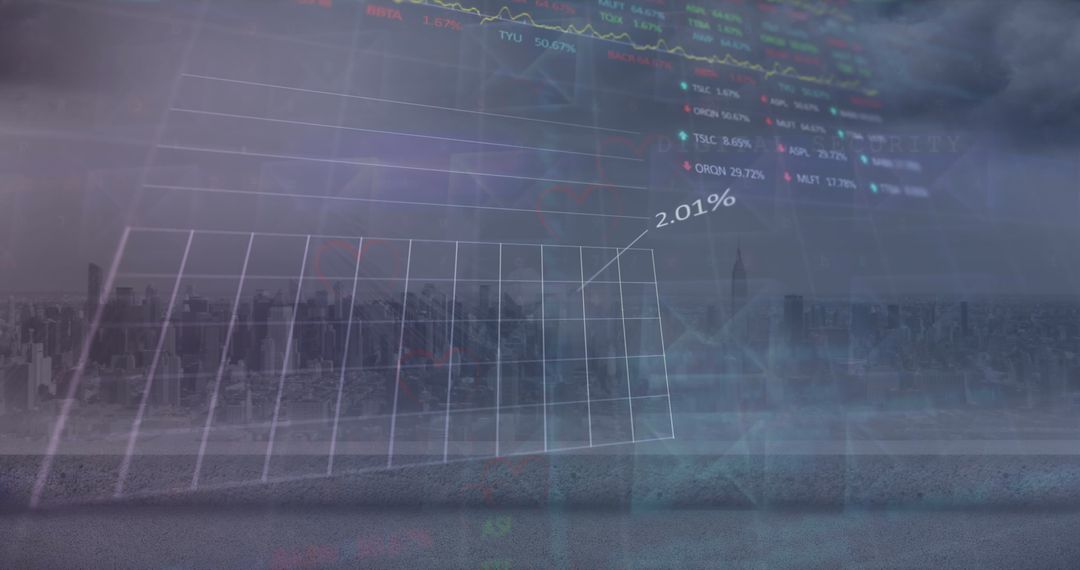
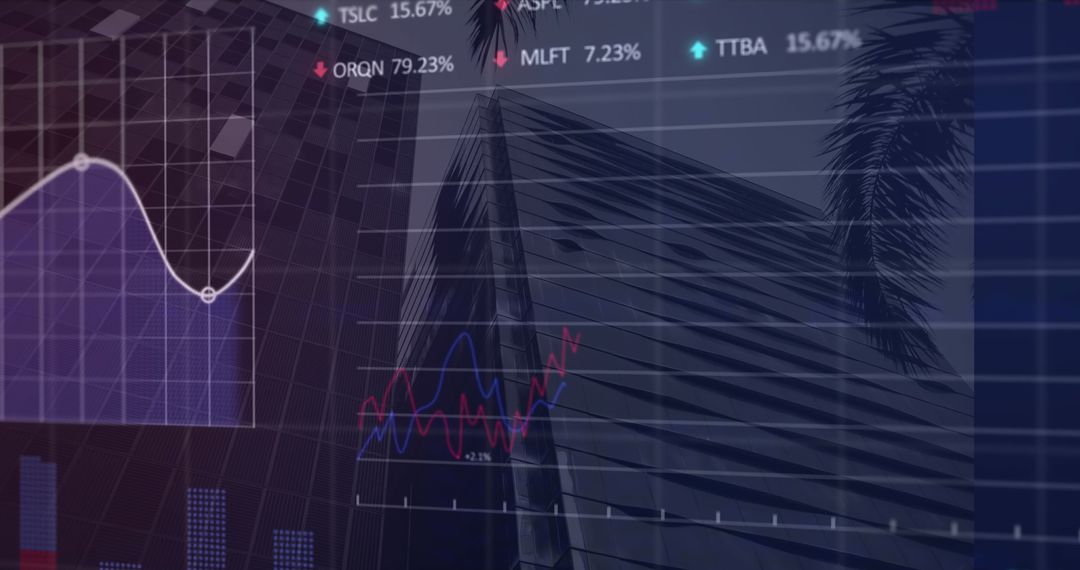
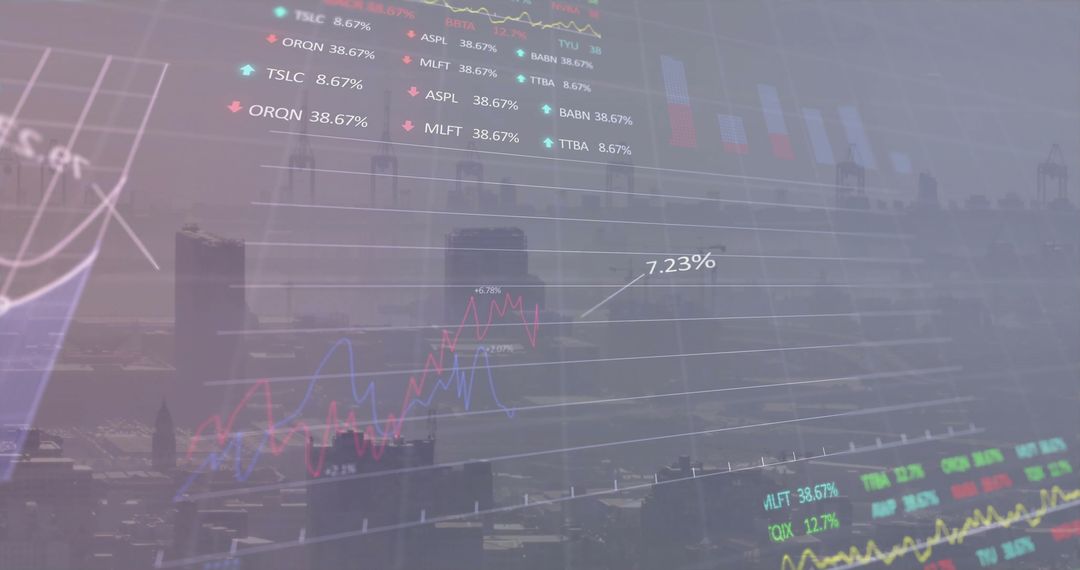
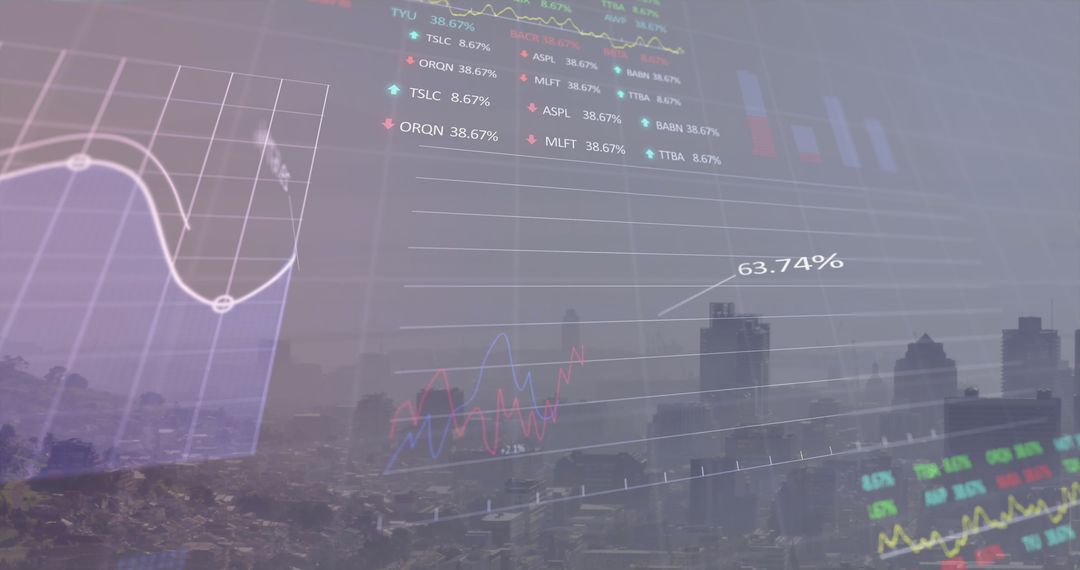
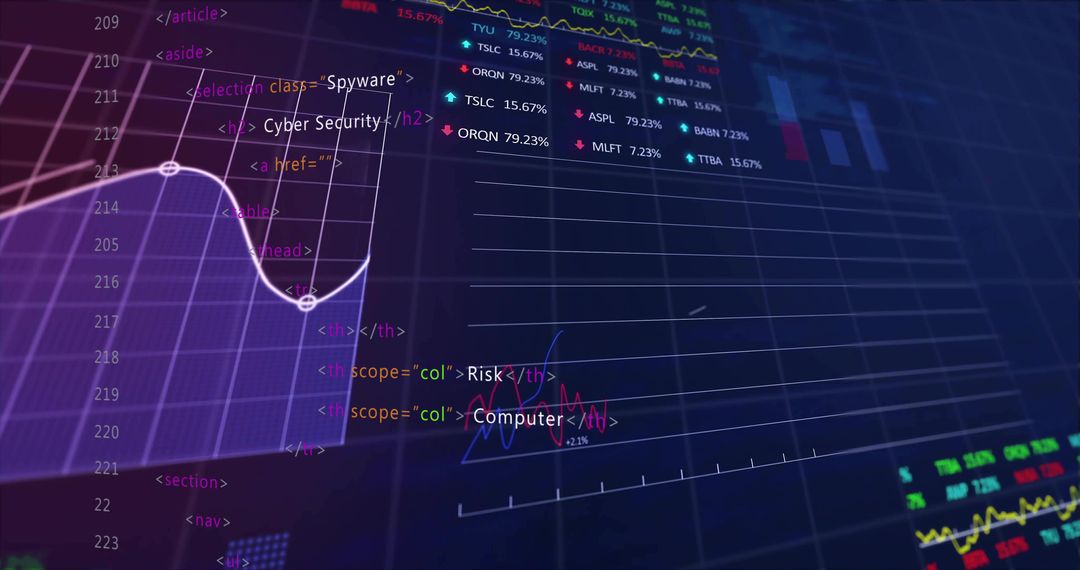
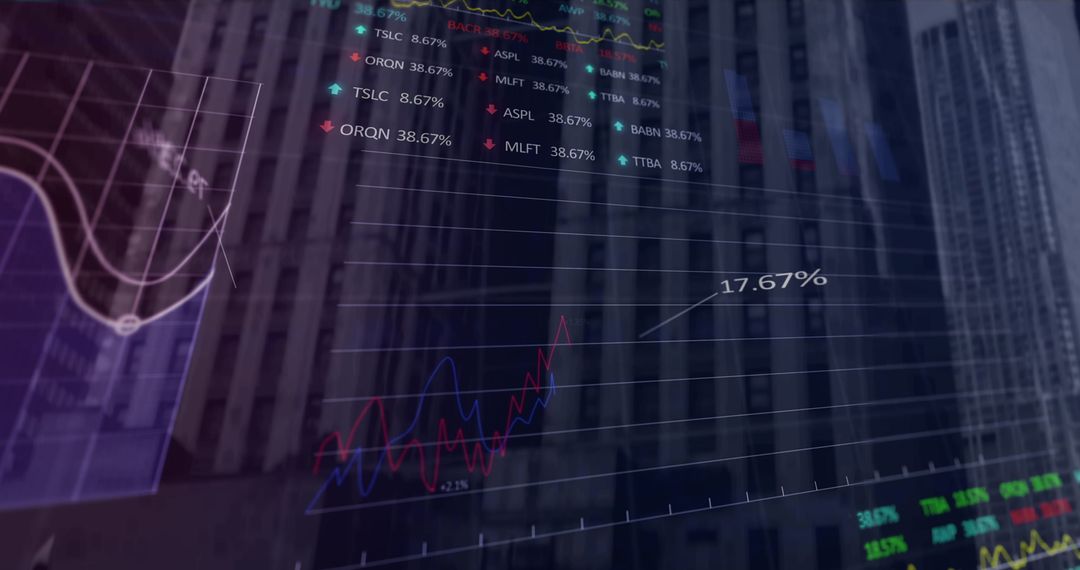
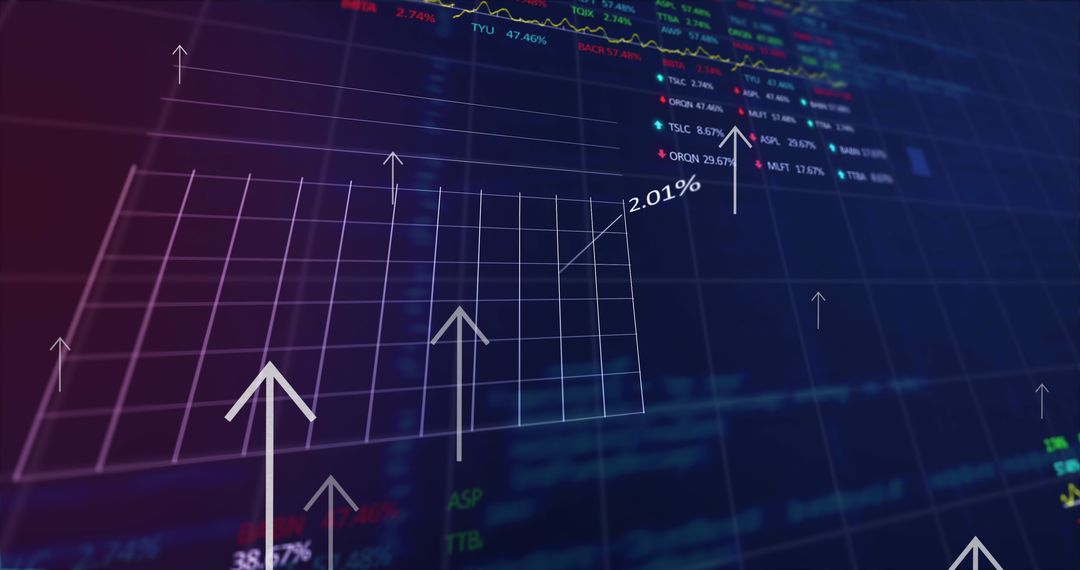
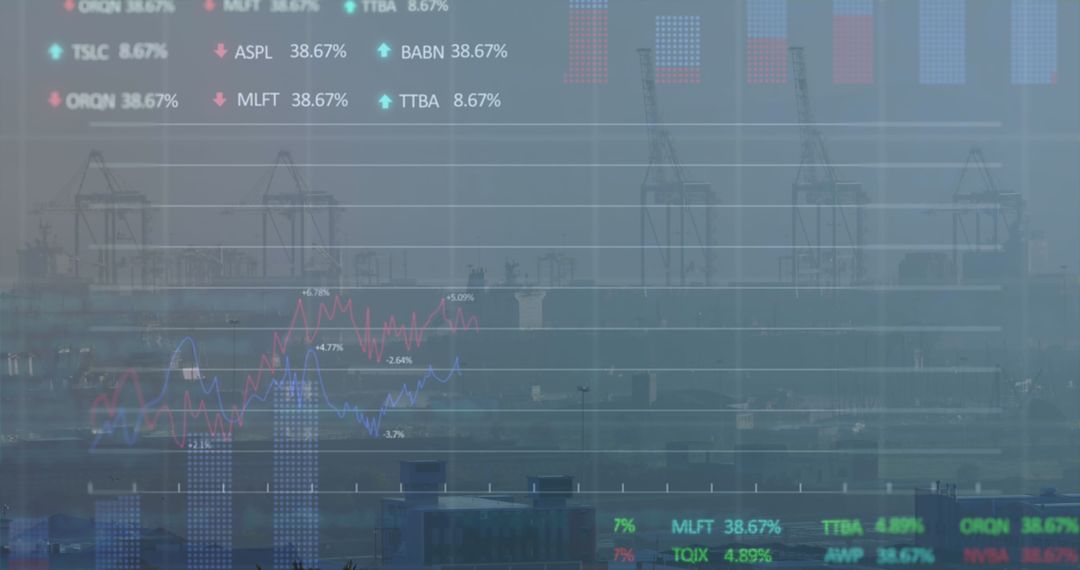
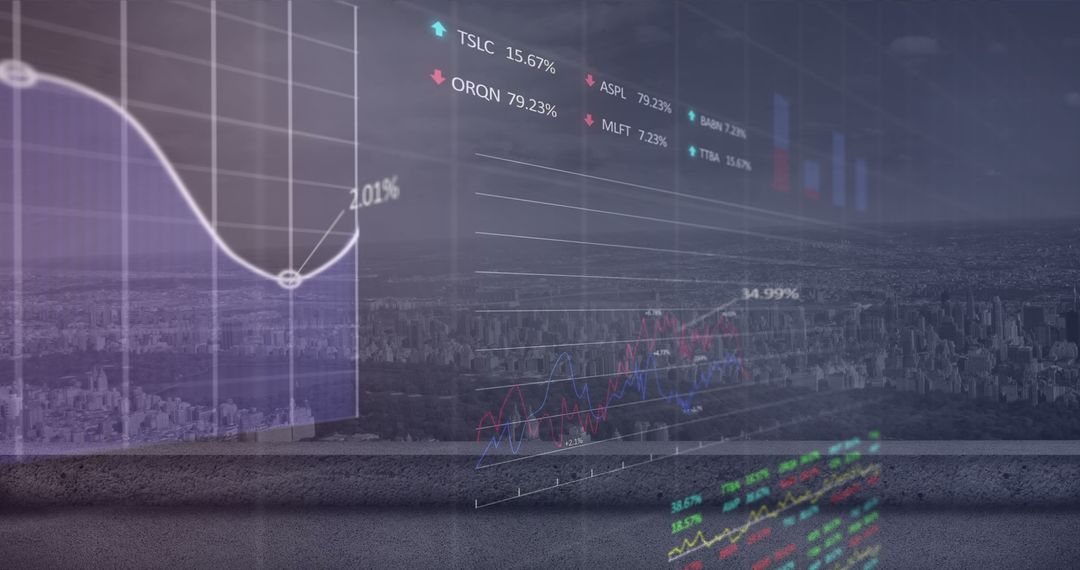
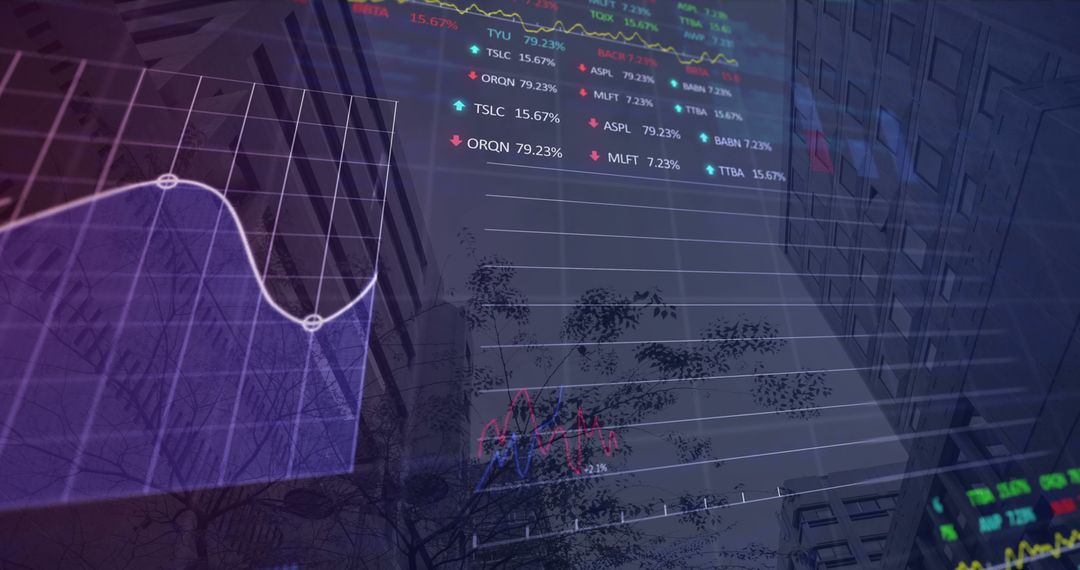
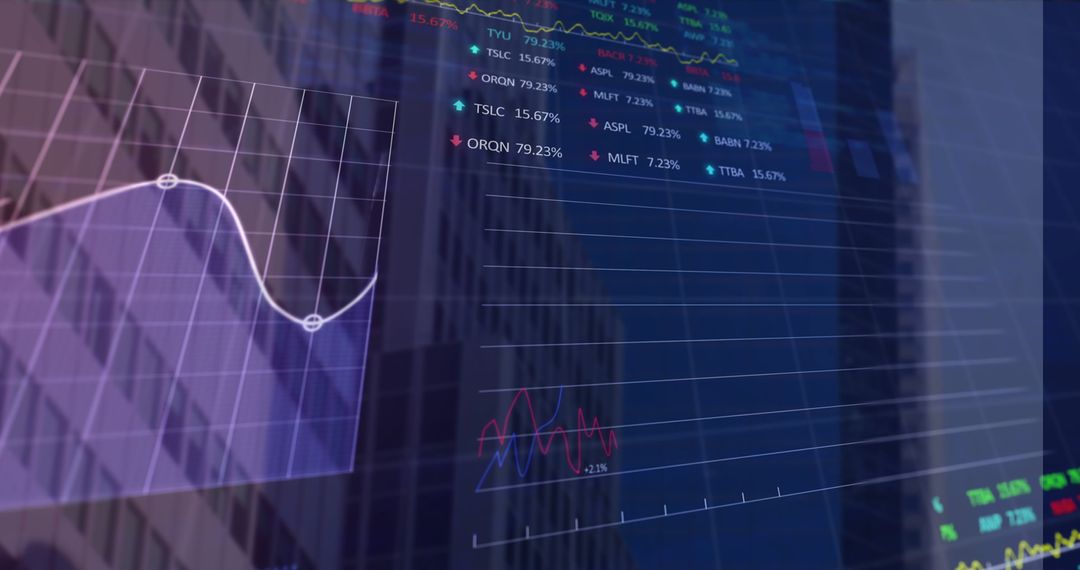
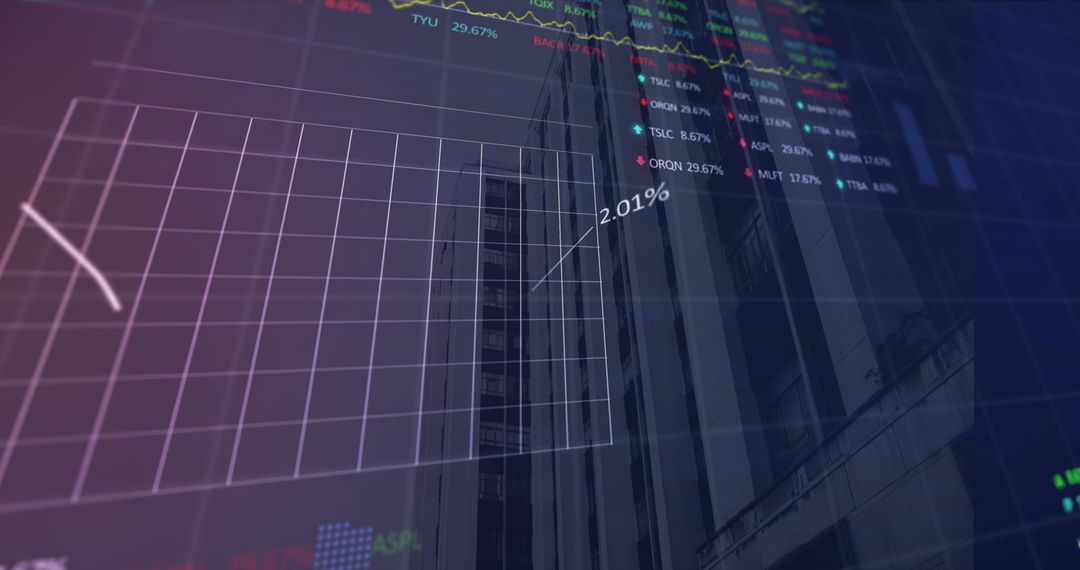
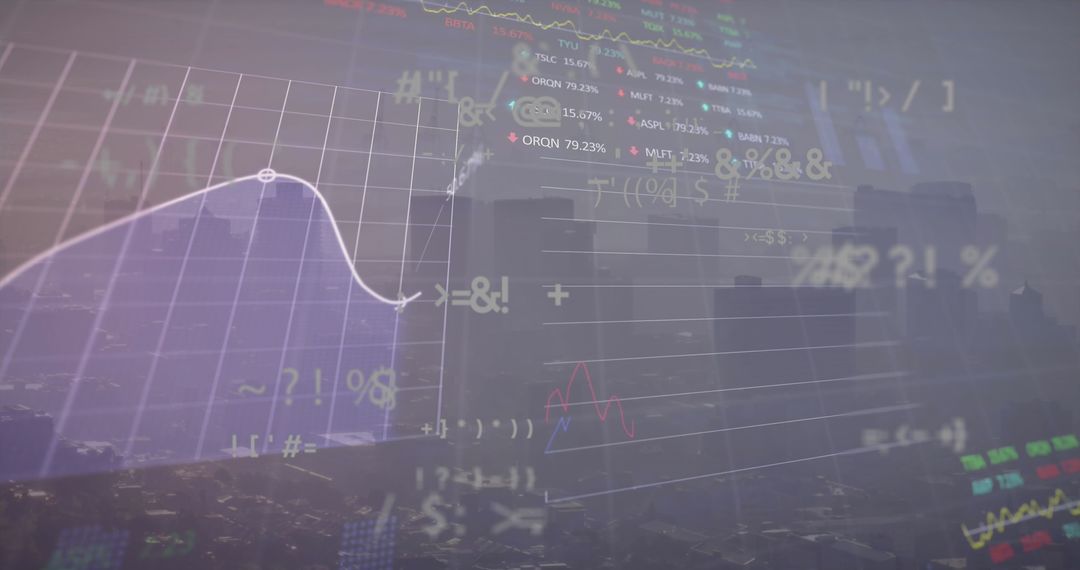
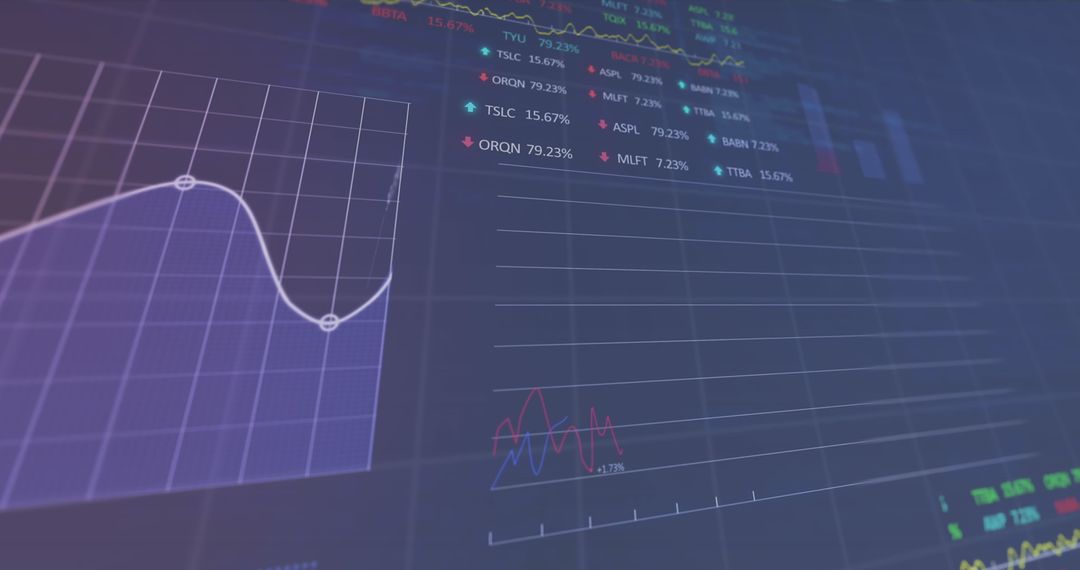
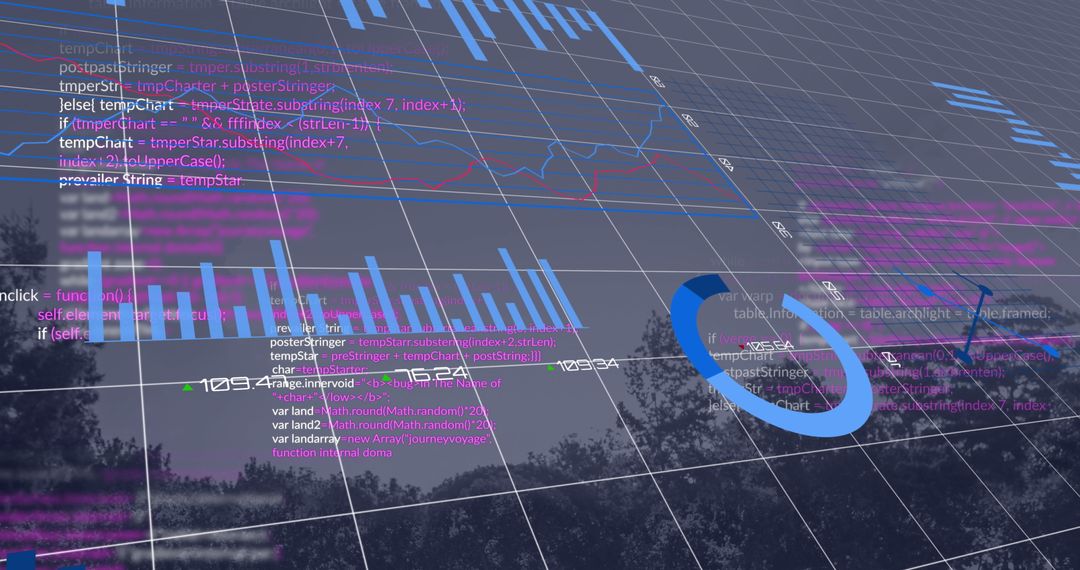
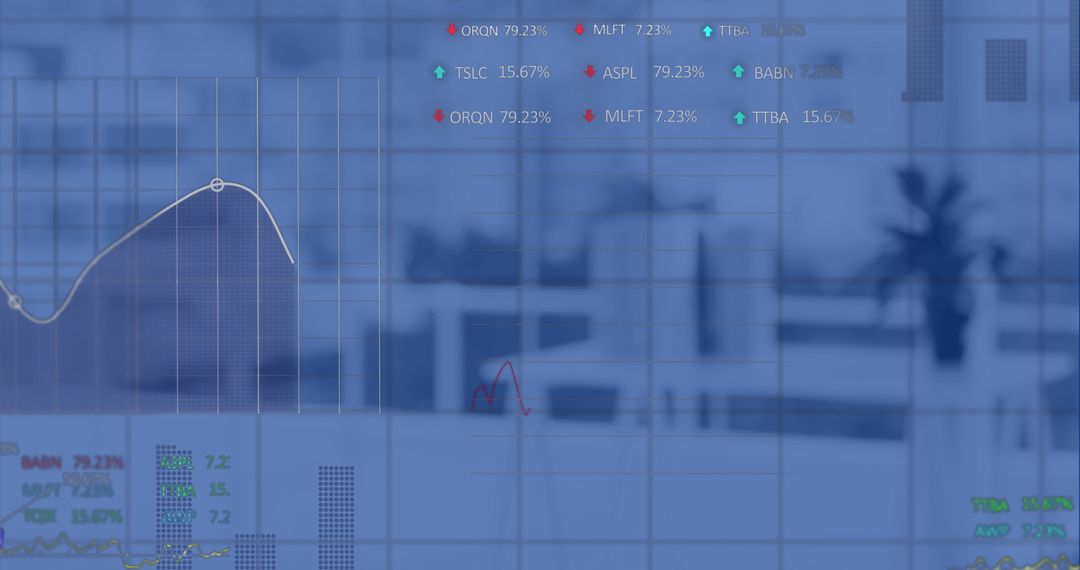
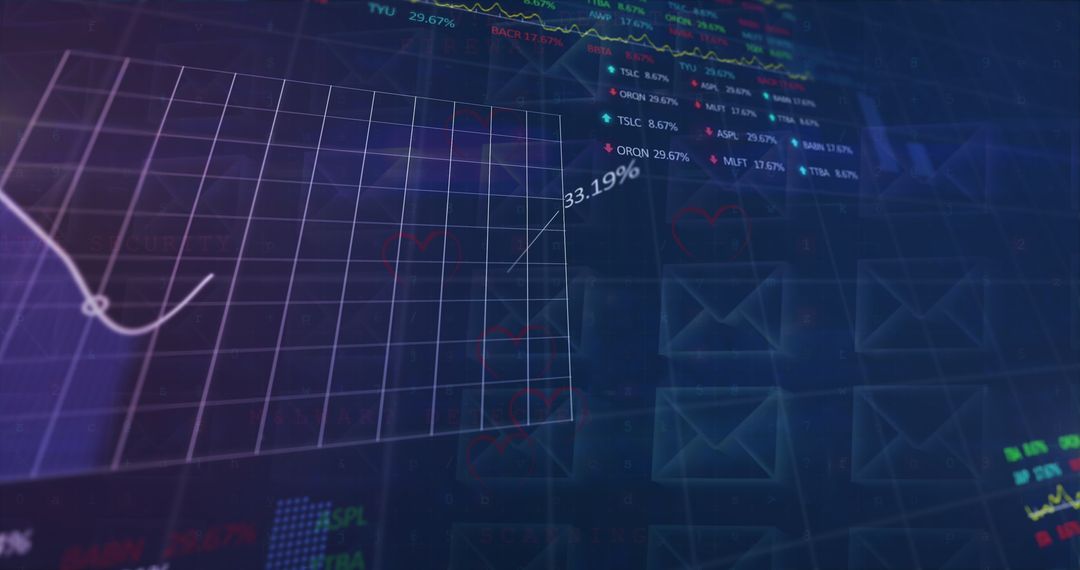
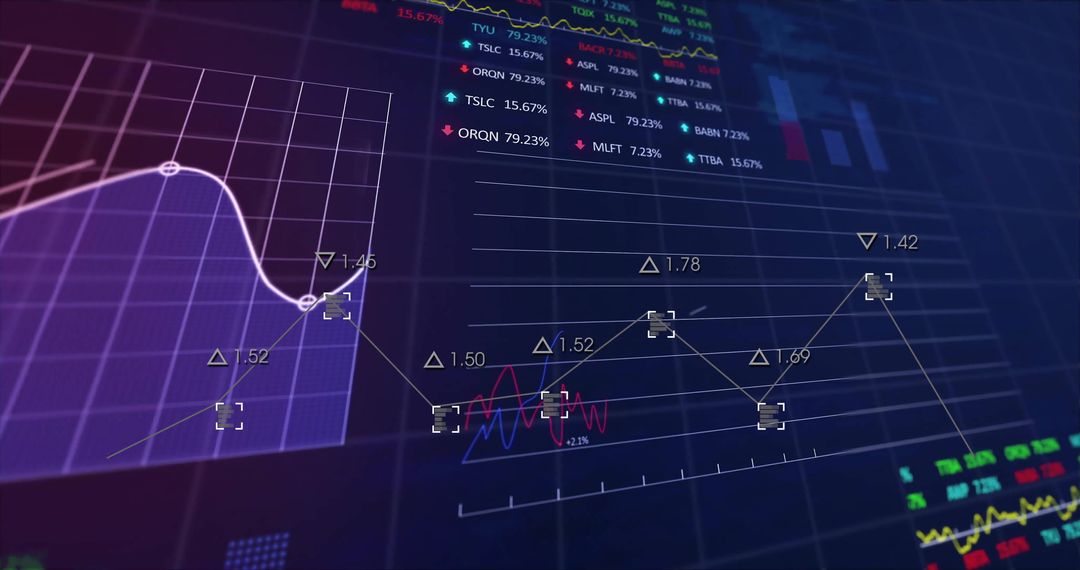
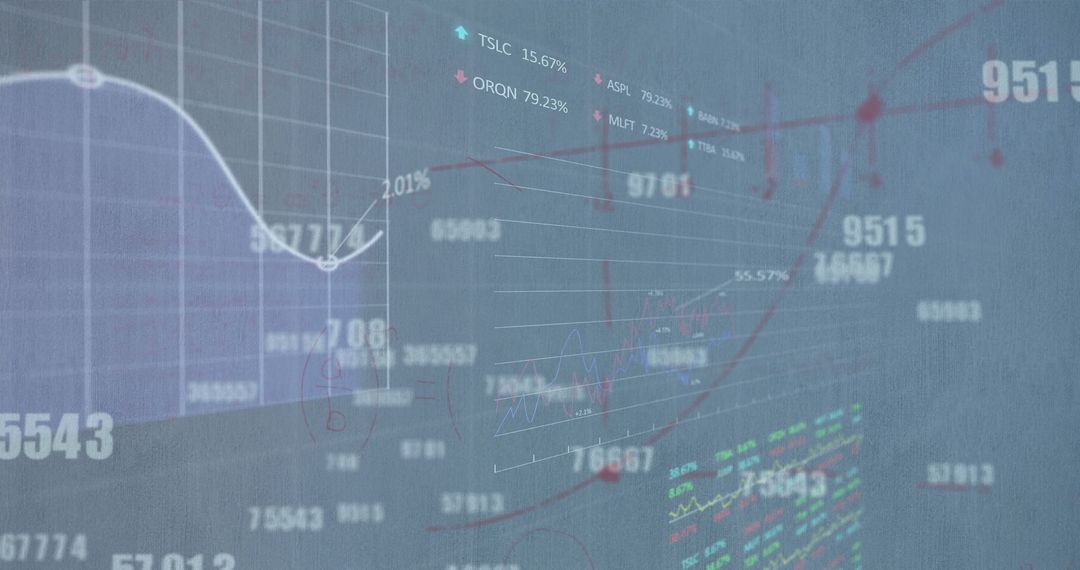
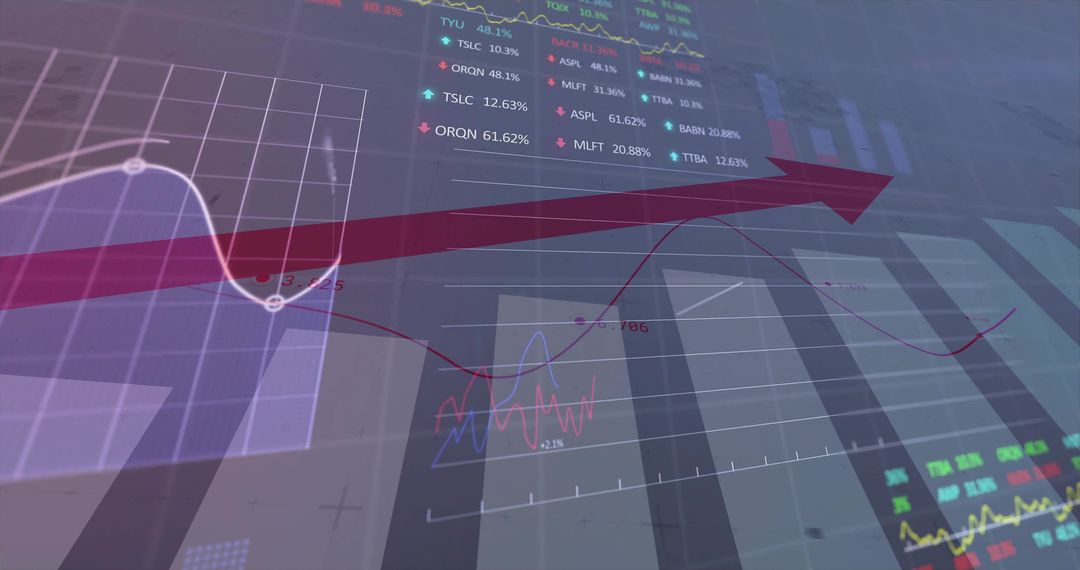
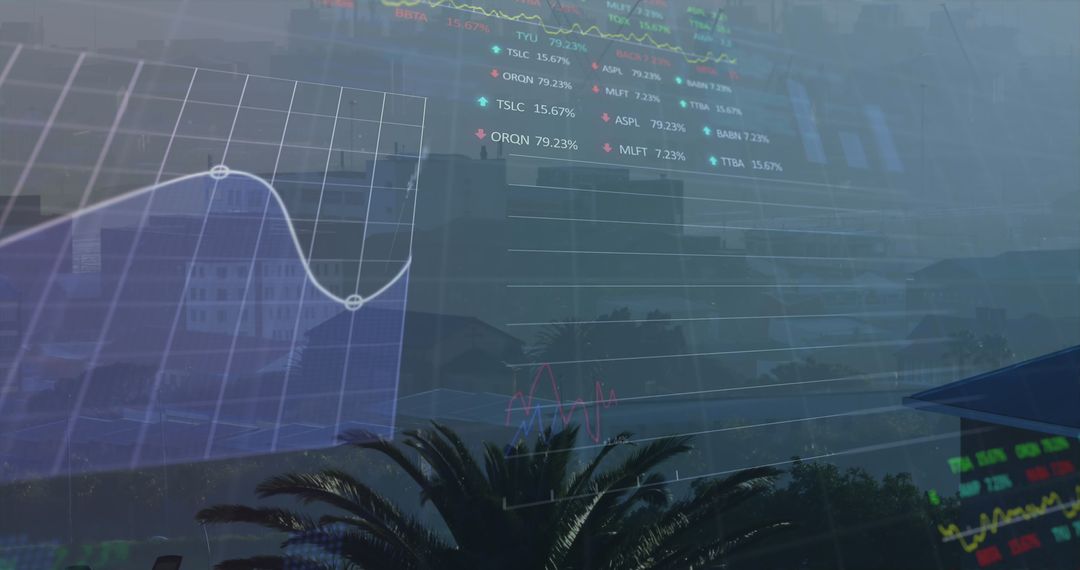
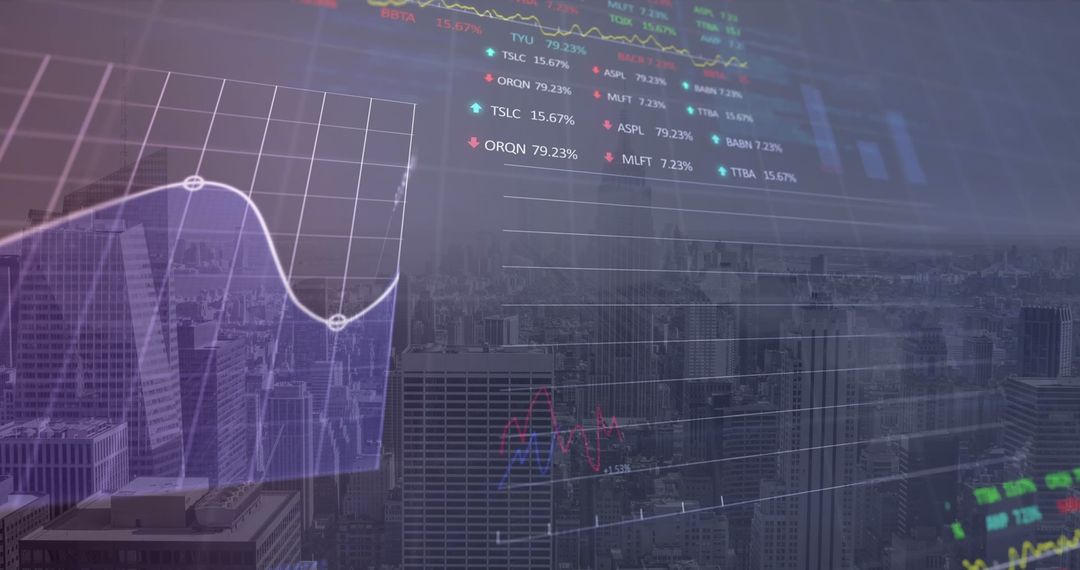
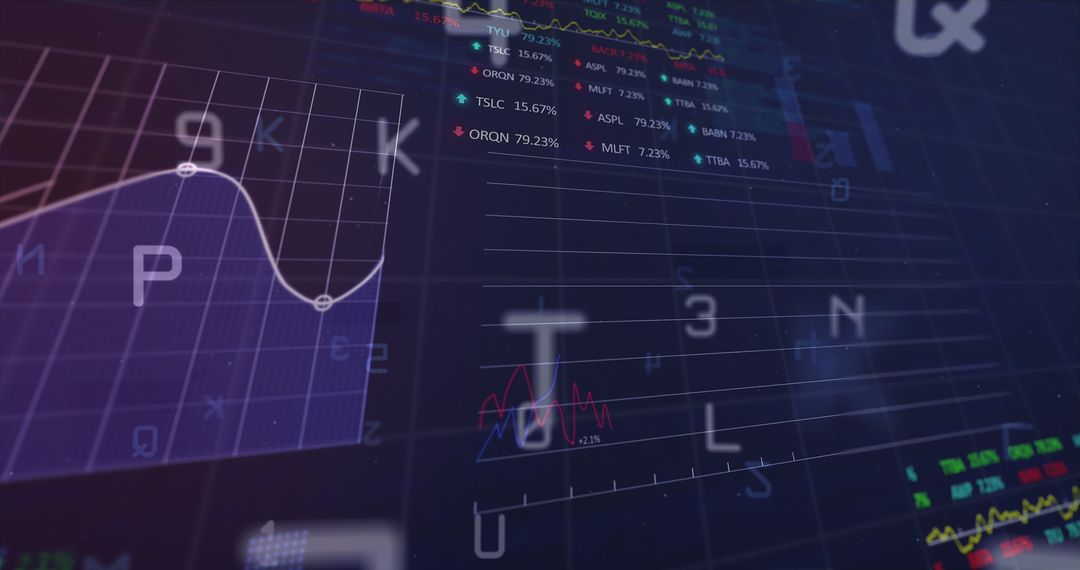
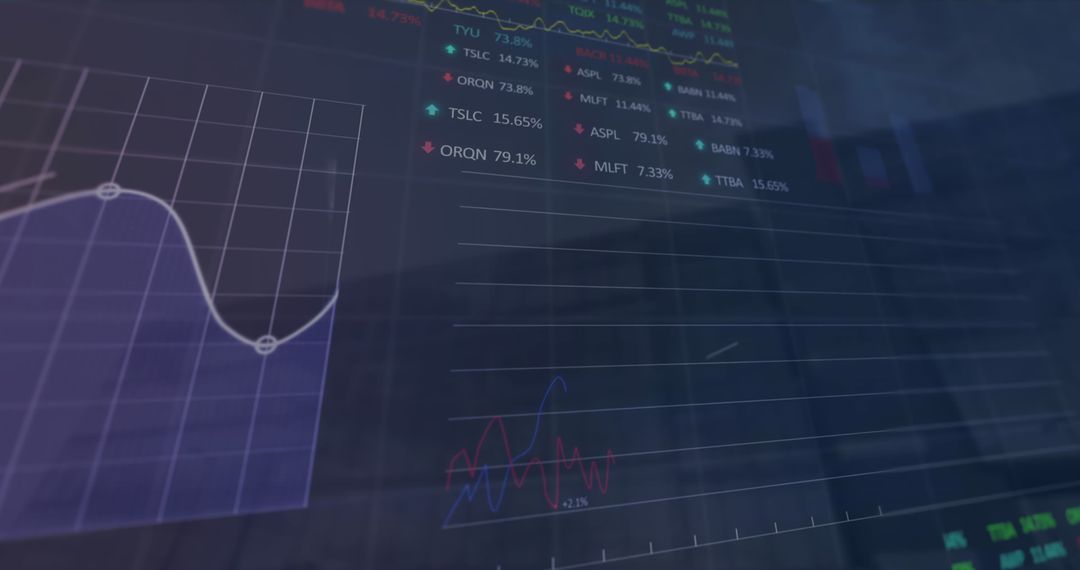
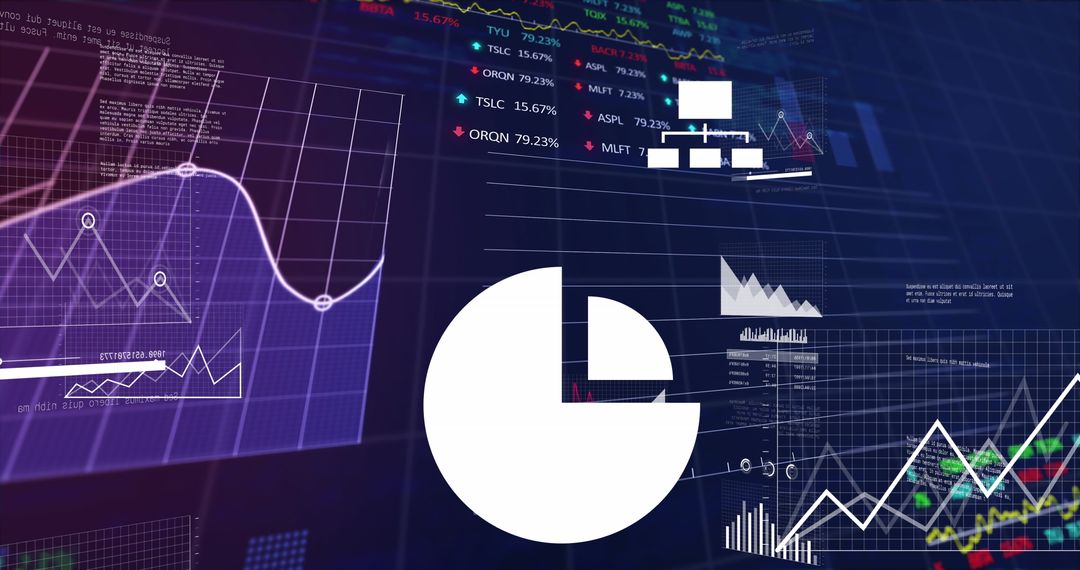
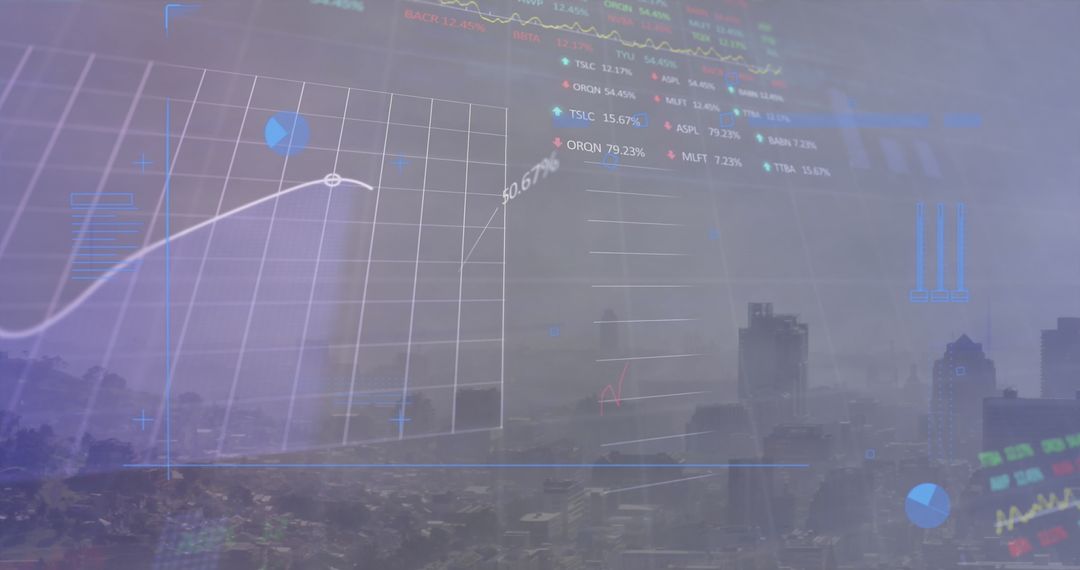
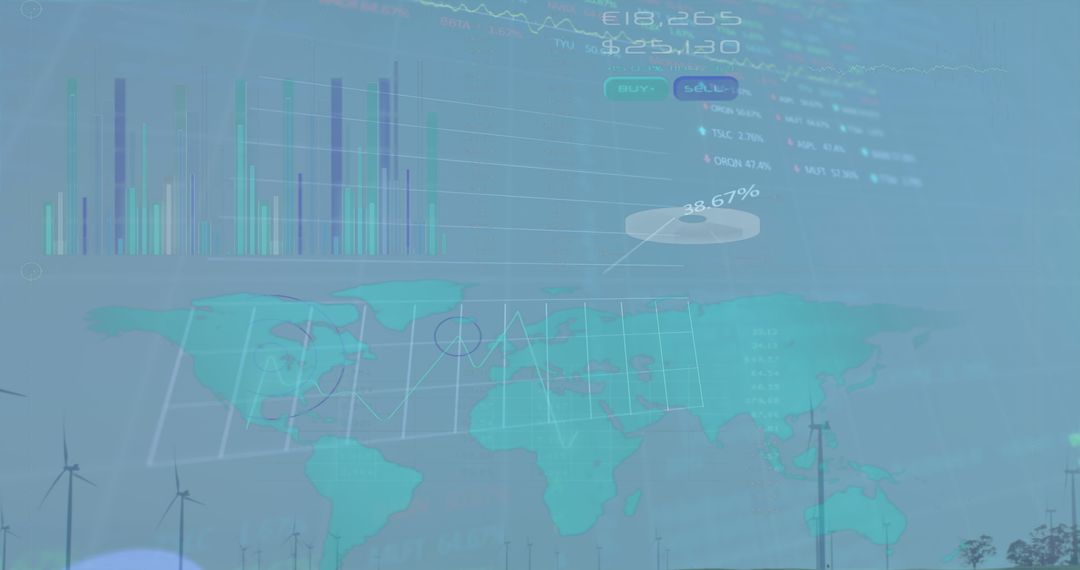
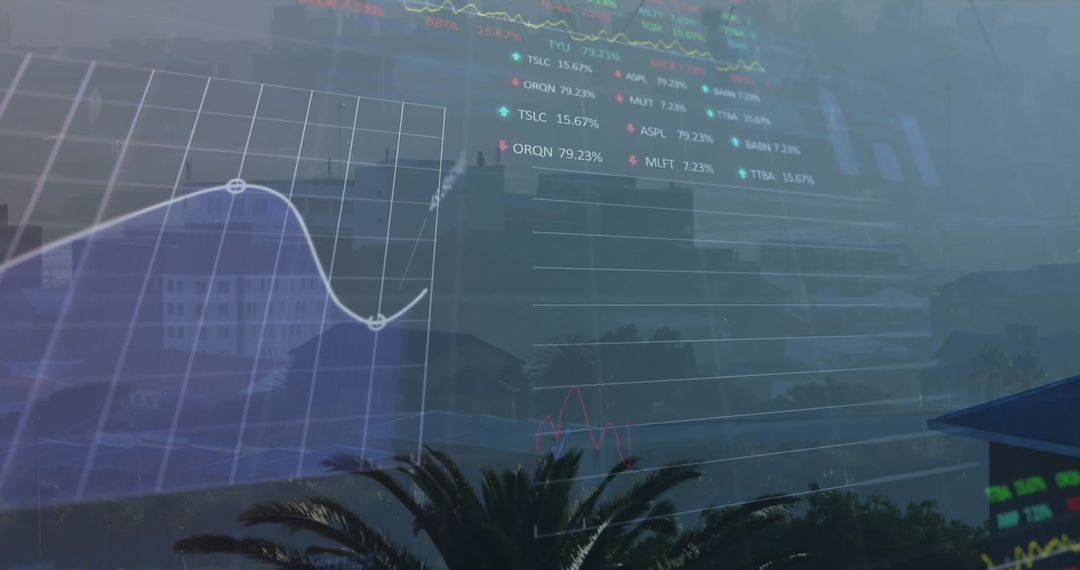
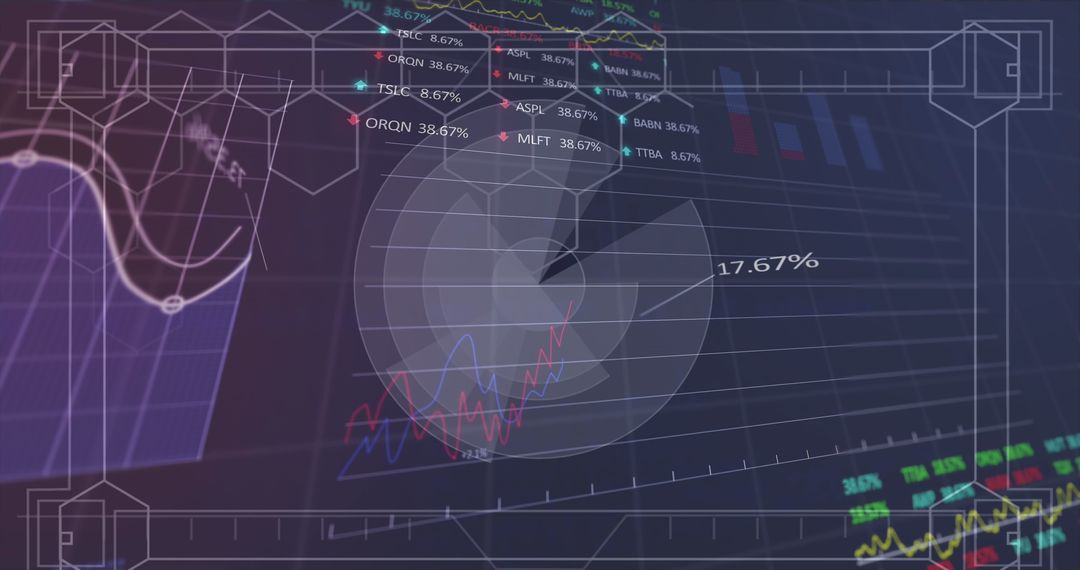
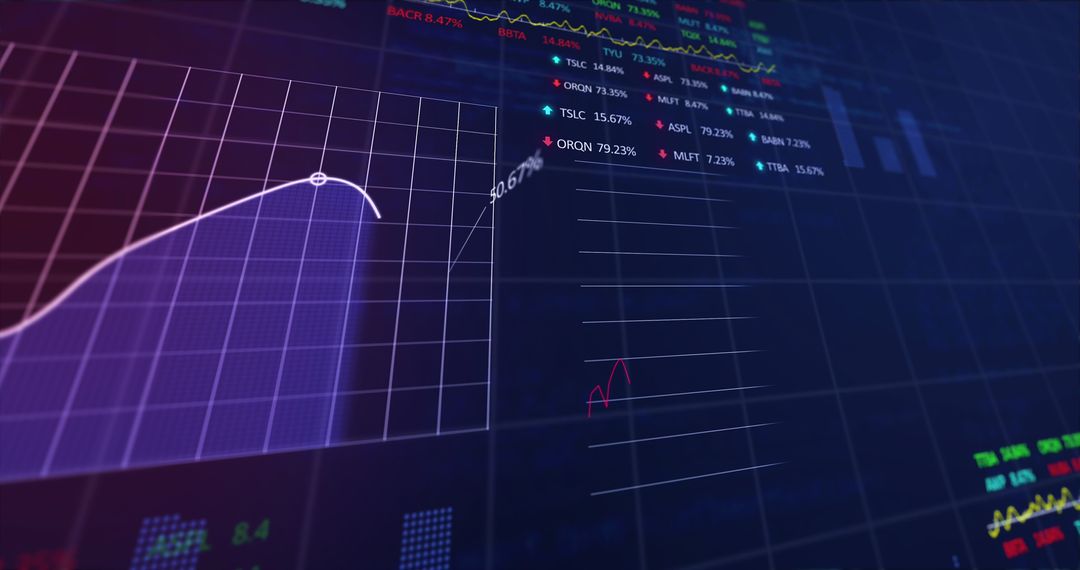
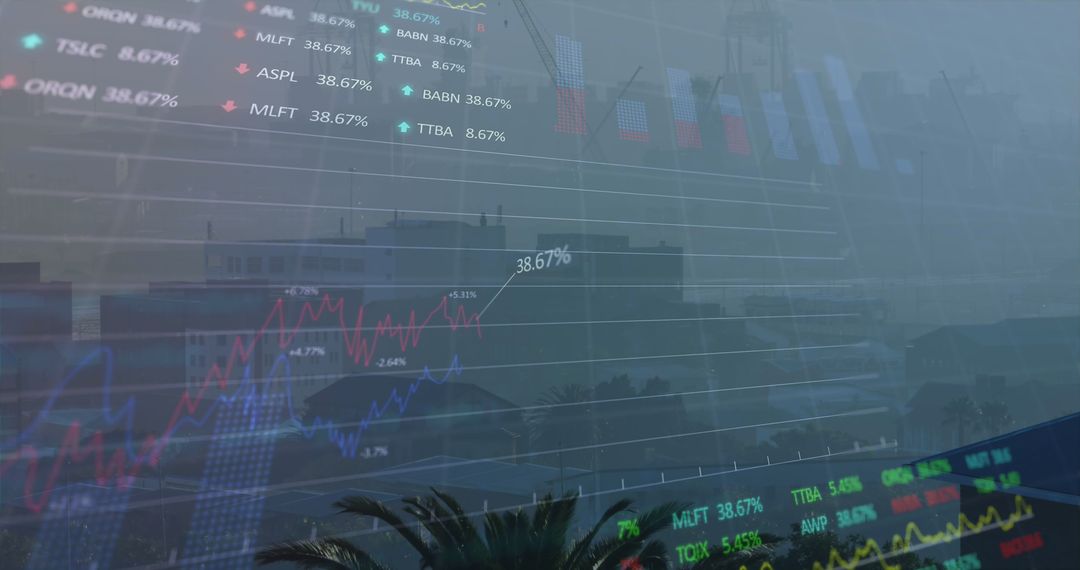
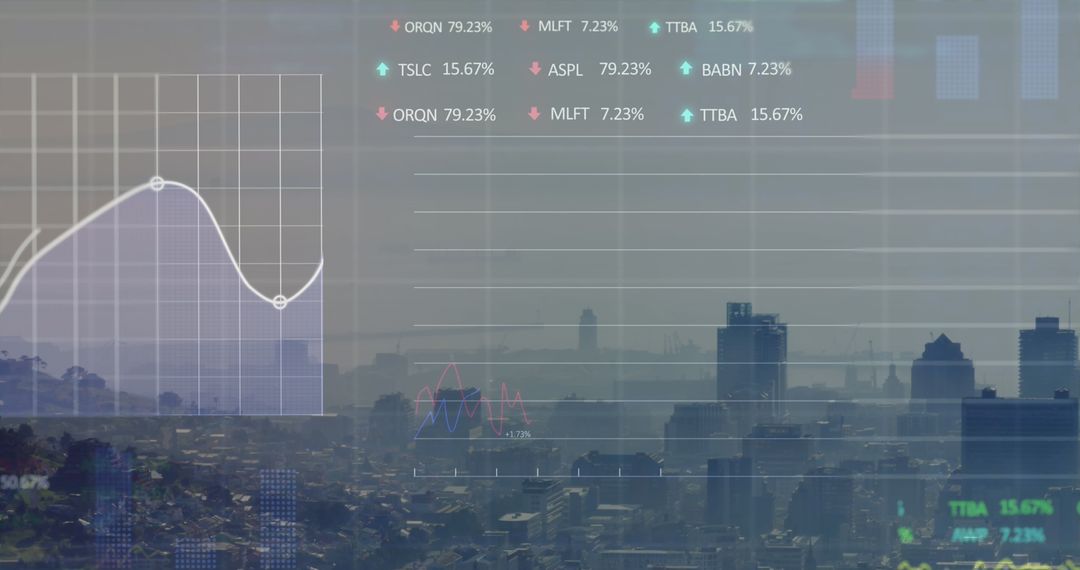
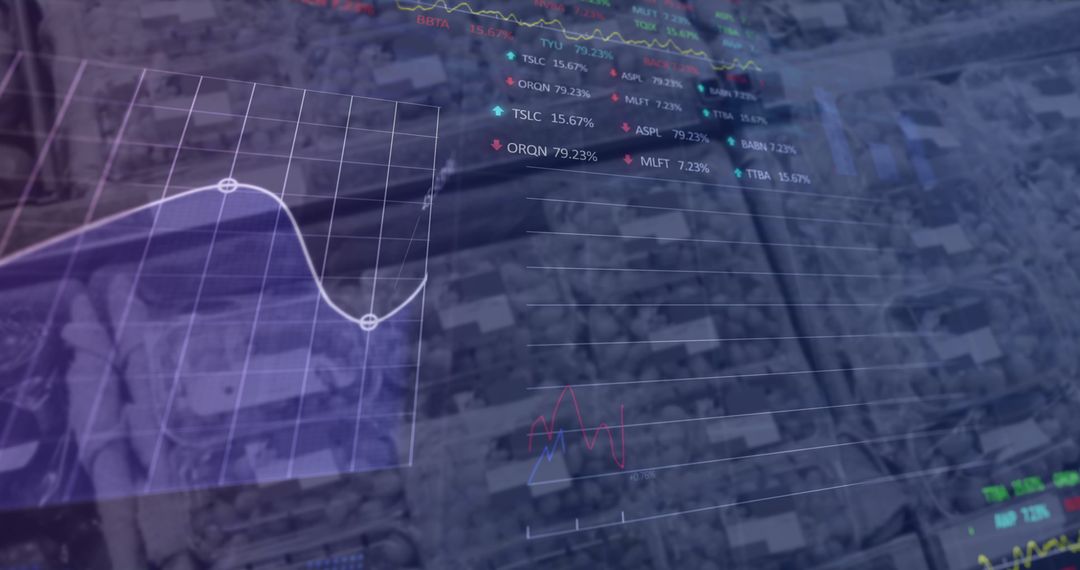
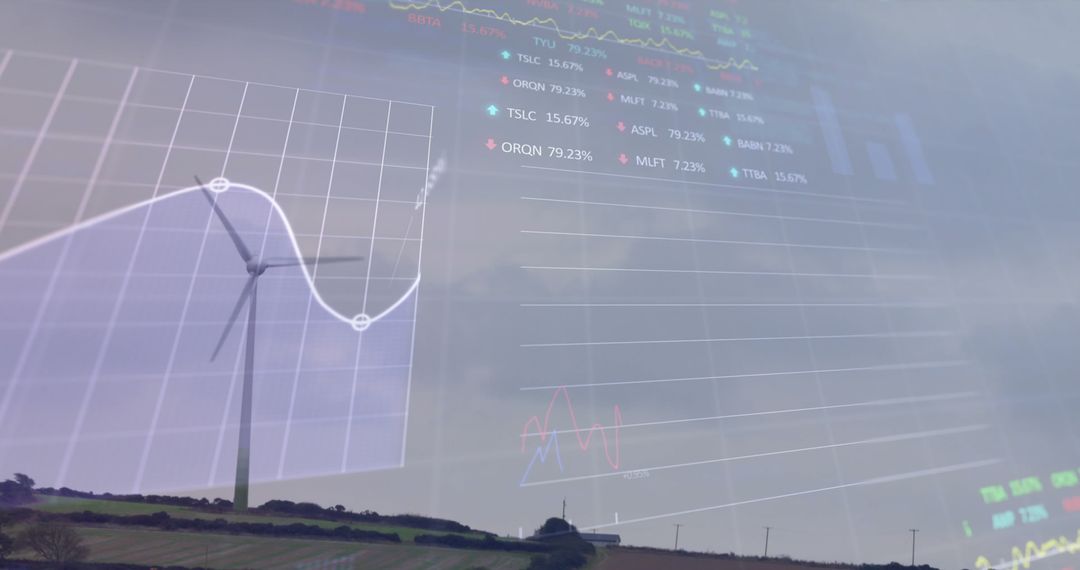
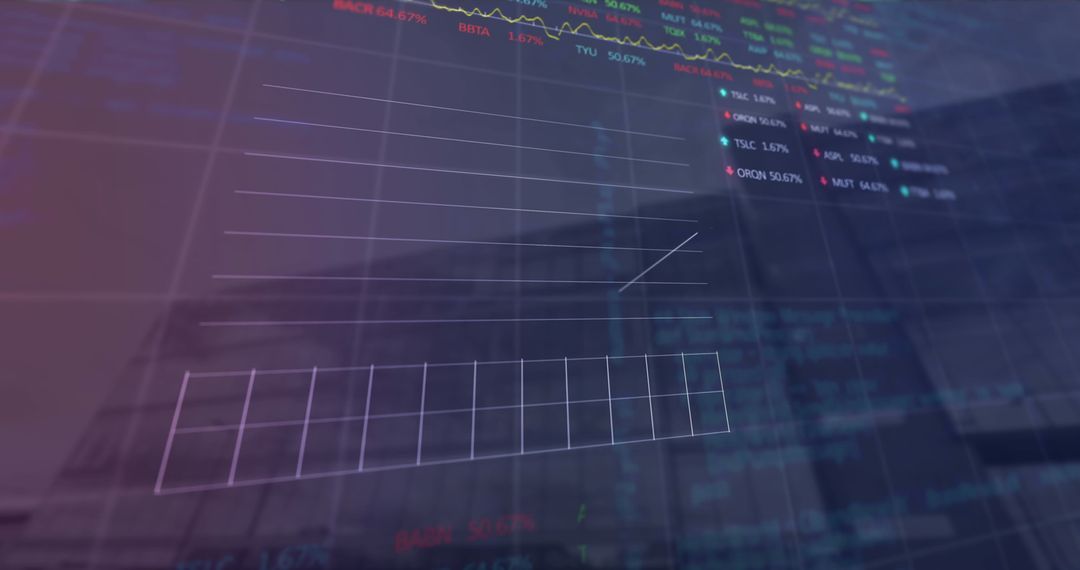
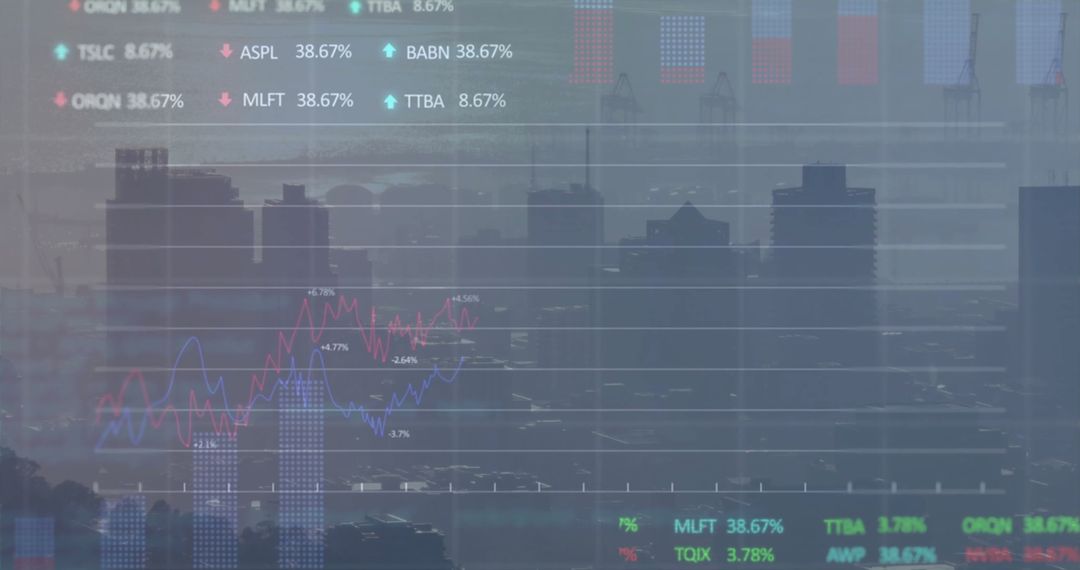
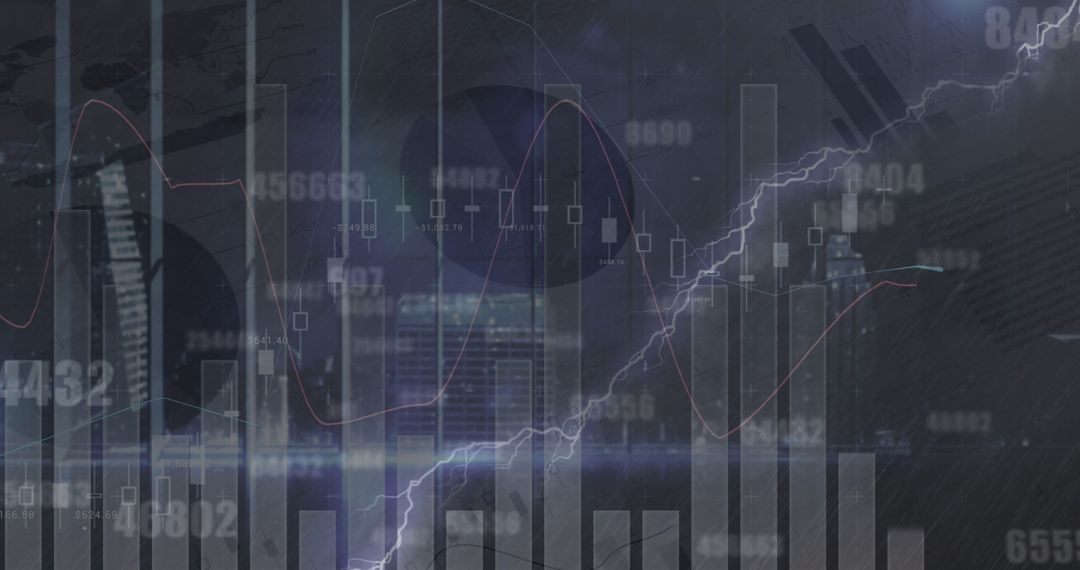
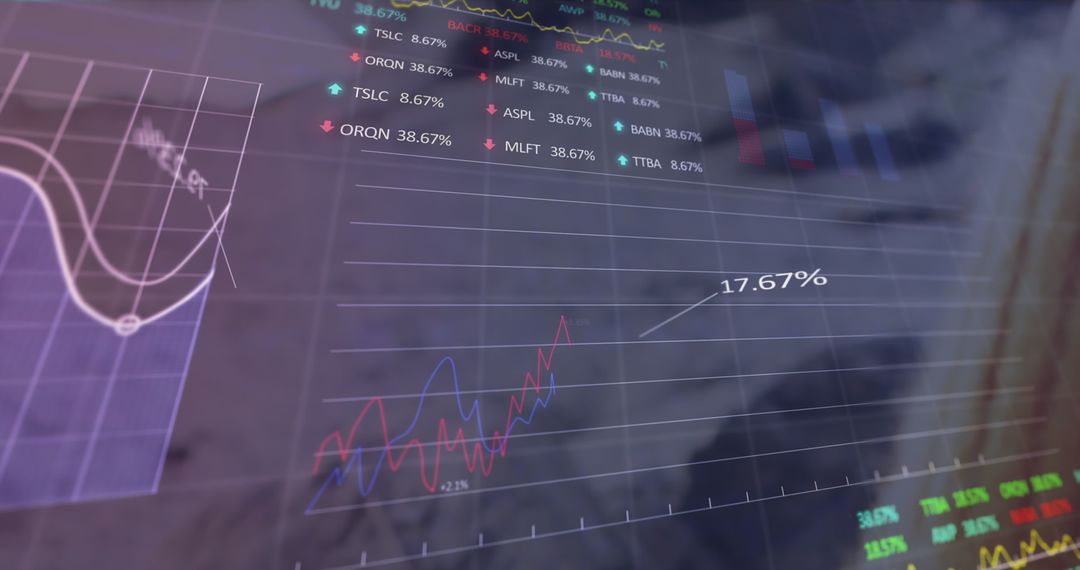
Image shows digital financial data overlayed with graphs and charts such as line graphs and stock charts, representing economic trends over time, with years marked like 2008 and 2013. Modern city skyline is visible in the background. Useful for articles highlighting finance analysis, economic reports, stock market insights, and technology in investment analysis packaging.
Powered by  - Get 15% off with code: PIKWIZARD15


2
downloads
downloads
Tags:
More
Credit Photo
If you would like to credit the Photo, here are some ways you can do so
Text Link
photo Link
<span class="text-link">
<span>
<a target="_blank" href=https://pikwizard.com/photo/digital-financial-data-with-business-charts-revealing-economic-trends/cdcfacb4fd5e791d7e7690fe23c94389/>PikWizard</a>
</span>
</span>
<span class="image-link">
<span
style="margin: 0 0 20px 0; display: inline-block; vertical-align: middle; width: 100%;"
>
<a
target="_blank"
href="https://pikwizard.com/photo/digital-financial-data-with-business-charts-revealing-economic-trends/cdcfacb4fd5e791d7e7690fe23c94389/"
style="text-decoration: none; font-size: 10px; margin: 0;"
>
<img src="https://pikwizard.com/pw/medium/cdcfacb4fd5e791d7e7690fe23c94389.jpg" style="margin: 0; width: 100%;" alt="" />
<p style="font-size: 12px; margin: 0;">PikWizard</p>
</a>
</span>
</span>
Free (free of charge)
Free for personal and commercial use.
Author: Creative Art
Similar Free Stock Images
Premium


Premium


Premium


Premium


Premium


Premium


Premium

Premium


Premium


Premium


Premium


Premium


Premium

Premium


Premium


Premium


Premium


Premium


Premium


Premium


Premium

Premium


Premium


Premium

