
- Home >
- Stock Photos >
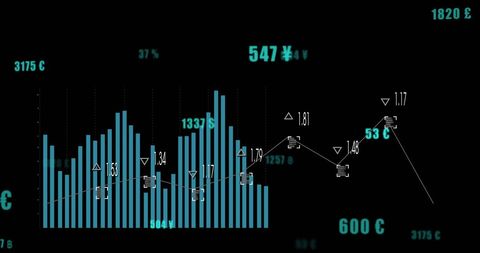
- Digital Financial Data with Declining Graph
Digital Financial Data with Declining Graph Image

Visual representation of purple bars and a declining line graph on a digital interface conveys finance and stock market trends. Useful for illustrating global finance concepts, business presentations, and digital interfaces focusing on economic analysis. Suitable for websites discussing market instability or stock data visualization.
Powered by 


downloads
Tags:
More
Credit Photo
If you would like to credit the Photo, here are some ways you can do so
Text Link
photo Link
<span class="text-link">
<span>
<a target="_blank" href=https://pikwizard.com/photo/digital-financial-data-with-declining-graph/96bf801827e7812ce5e8b22ae3435a6c/>PikWizard</a>
</span>
</span>
<span class="image-link">
<span
style="margin: 0 0 20px 0; display: inline-block; vertical-align: middle; width: 100%;"
>
<a
target="_blank"
href="https://pikwizard.com/photo/digital-financial-data-with-declining-graph/96bf801827e7812ce5e8b22ae3435a6c/"
style="text-decoration: none; font-size: 10px; margin: 0;"
>
<img src="https://pikwizard.com/pw/medium/96bf801827e7812ce5e8b22ae3435a6c.jpg" style="margin: 0; width: 100%;" alt="" />
<p style="font-size: 12px; margin: 0;">PikWizard</p>
</a>
</span>
</span>
Free (free of charge)
Free for personal and commercial use.
Author: Awesome Content
Similar Free Stock Images

Premium


Premium

Premium


Premium


Premium


Premium

Premium

Premium


Premium


Premium

Premium


Premium

Premium

Premium


Premium


Premium


Premium


Premium


Premium


Premium

Premium


Premium


Premium


Premium


Premium


Explore More Free Stock Images