
- Home >
- Stock Photos >
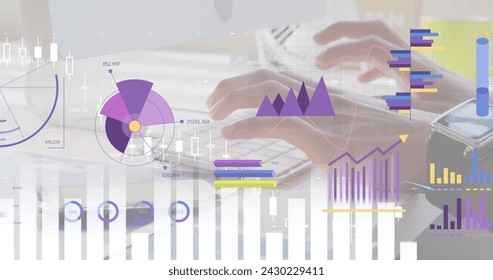
- Digital Financial Data with Graph Analysis in Progress
Digital Financial Data with Graph Analysis in Progress Image
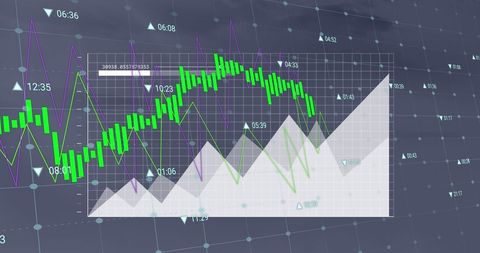
This image displays a digital representation of financial data being processed with graph analysis. Suitable for illustrating concepts related to global markets, financial forecasting, and data analytics. Ideal for use in presentations, financial reports, and educational material on economic trends and digital technology impacts on the economy.
Powered by  - Get 15% off with code: PIKWIZARD15


downloads
Tags:
More
Credit Photo
If you would like to credit the Photo, here are some ways you can do so
Text Link
photo Link
<span class="text-link">
<span>
<a target="_blank" href=https://pikwizard.com/photo/digital-financial-data-with-graph-analysis-in-progress/ddbc62d67d84d44e65a21c53c5d6c0e1/>PikWizard</a>
</span>
</span>
<span class="image-link">
<span
style="margin: 0 0 20px 0; display: inline-block; vertical-align: middle; width: 100%;"
>
<a
target="_blank"
href="https://pikwizard.com/photo/digital-financial-data-with-graph-analysis-in-progress/ddbc62d67d84d44e65a21c53c5d6c0e1/"
style="text-decoration: none; font-size: 10px; margin: 0;"
>
<img src="https://pikwizard.com/pw/medium/ddbc62d67d84d44e65a21c53c5d6c0e1.jpg" style="margin: 0; width: 100%;" alt="" />
<p style="font-size: 12px; margin: 0;">PikWizard</p>
</a>
</span>
</span>
Free (free of charge)
Free for personal and commercial use.
Author: Authentic Images
Similar Free Stock Images

Premium

Premium

Premium


Premium

Premium


Premium


Premium

Premium


Premium


Premium

Premium

Premium


Premium


Premium


Premium

Premium


Premium

Premium


Premium


Premium

Premium


Premium

Premium


Premium


Premium


Explore More Free Stock Images