
- Home >
- Stock Photos >
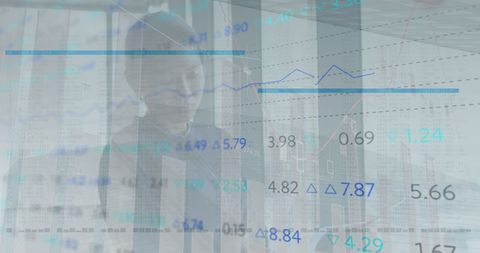
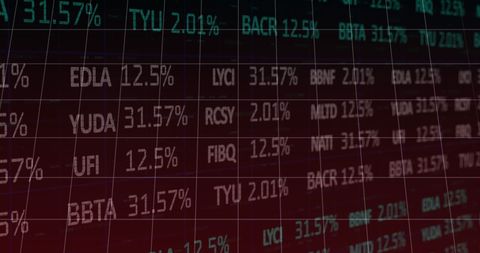
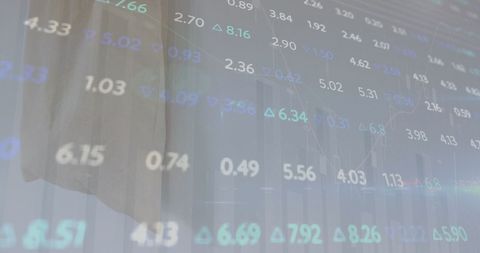
- Digital Financial Data with Graphical Analysis Overlay
Digital Financial Data with Graphical Analysis Overlay Image

The scene depicts numerical data overlaid with graphical charts, indicative of financial market analysis or data analytics. Useful in business presentations, finance-related content, or computing technology projects, showcasing aspects of data processing, economic trends, and global financial transactions.
Powered by 


downloads
Tags:
More
Credit Photo
If you would like to credit the Photo, here are some ways you can do so
Text Link
photo Link
<span class="text-link">
<span>
<a target="_blank" href=https://pikwizard.com/photo/digital-financial-data-with-graphical-analysis-overlay/c0a2e714c7ebc7af9fb9488c686b9070/>PikWizard</a>
</span>
</span>
<span class="image-link">
<span
style="margin: 0 0 20px 0; display: inline-block; vertical-align: middle; width: 100%;"
>
<a
target="_blank"
href="https://pikwizard.com/photo/digital-financial-data-with-graphical-analysis-overlay/c0a2e714c7ebc7af9fb9488c686b9070/"
style="text-decoration: none; font-size: 10px; margin: 0;"
>
<img src="https://pikwizard.com/pw/medium/c0a2e714c7ebc7af9fb9488c686b9070.jpg" style="margin: 0; width: 100%;" alt="" />
<p style="font-size: 12px; margin: 0;">PikWizard</p>
</a>
</span>
</span>
Free (free of charge)
Free for personal and commercial use.
Author: People Creations
Similar Free Stock Images

Premium


Premium

Premium


Premium


Premium


Premium


Premium


Premium


Premium


Premium


Premium


Premium


Premium


Premium


Premium


Premium


Premium


Premium


Premium


Premium


Premium


Premium


Premium


Premium

Premium


Explore More Free Stock Images