- Home >
- Stock Photos >
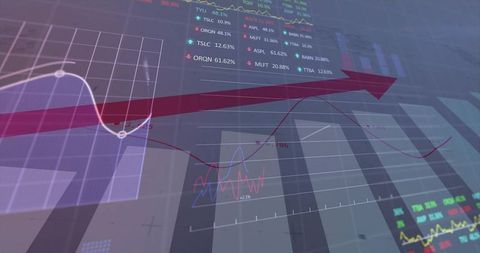
- Digital Financial Data with Graphs and Charts in Virtual Interface
Digital Financial Data with Graphs and Charts in Virtual Interface Image

This futuristic digital display showcases various graphs, charts, and statistics, representing financial data and analytics. The image is suitable for illustrating topics related to global finance, business intelligence, data processing, and stock market trends. It is an ideal visual for software interface mock-ups or articles about technology in the financial sector.

downloads
Tags:
More
Credit Photo
If you would like to credit the Photo, here are some ways you can do so
Text Link
photo Link
<span class="text-link">
<span>
<a target="_blank" href=https://pikwizard.com/photo/digital-financial-data-with-graphs-and-charts-in-virtual-interface/8a00ba650cfef39ee904b070457d5201/>PikWizard</a>
</span>
</span>
<span class="image-link">
<span
style="margin: 0 0 20px 0; display: inline-block; vertical-align: middle; width: 100%;"
>
<a
target="_blank"
href="https://pikwizard.com/photo/digital-financial-data-with-graphs-and-charts-in-virtual-interface/8a00ba650cfef39ee904b070457d5201/"
style="text-decoration: none; font-size: 10px; margin: 0;"
>
<img src="https://pikwizard.com/pw/medium/8a00ba650cfef39ee904b070457d5201.jpg" style="margin: 0; width: 100%;" alt="" />
<p style="font-size: 12px; margin: 0;">PikWizard</p>
</a>
</span>
</span>
Free (free of charge)
Free for personal and commercial use.
Author: Awesome Content