- Home >
- Stock Photos >
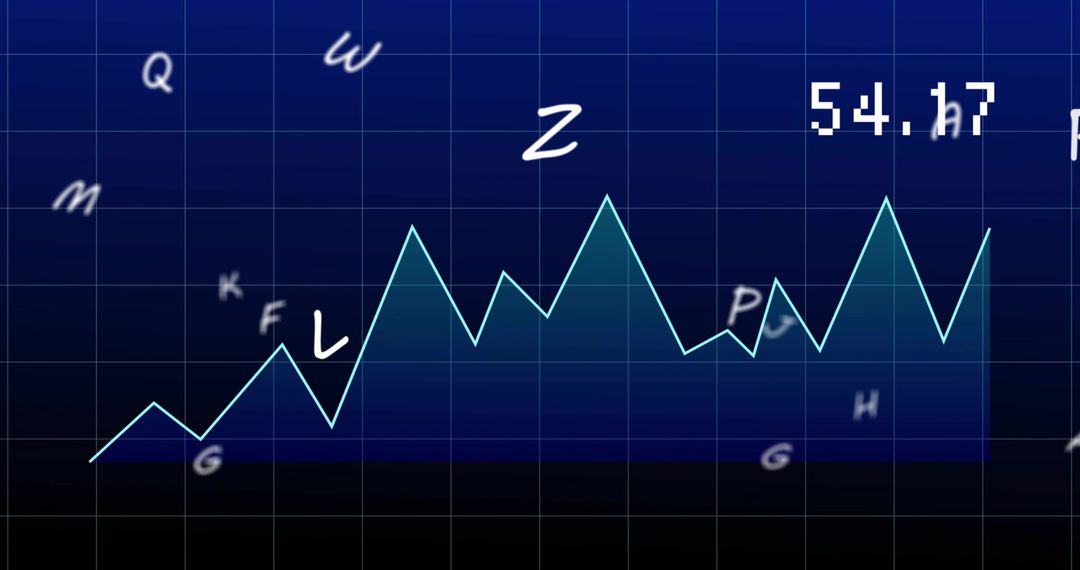
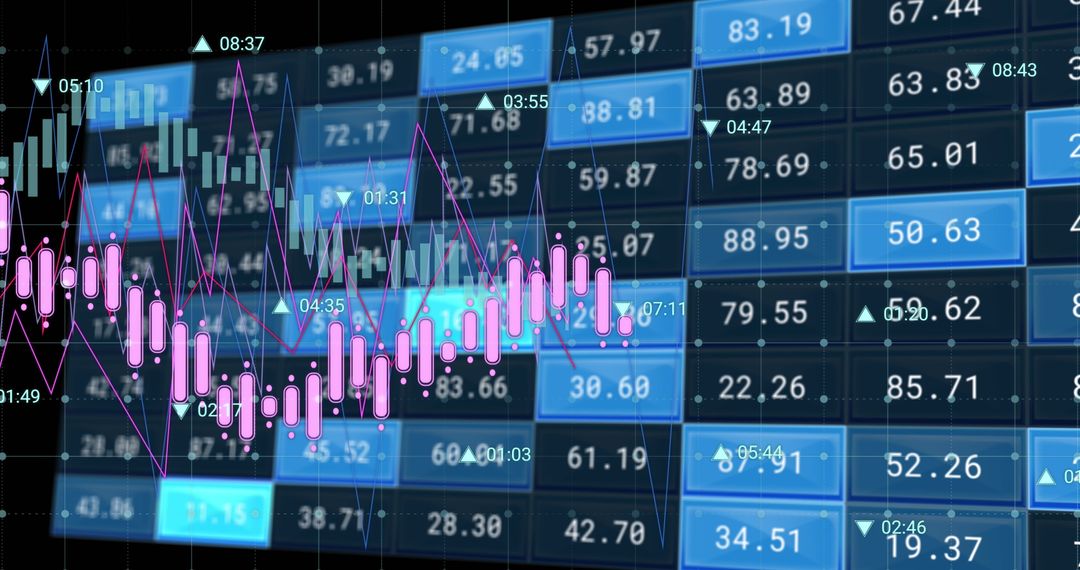
- Digital Financial Data with Graphs and Numbers Illustrations
Digital Financial Data with Graphs and Numbers Illustrations Image

Dynamic digital illustration representing financial data processing, incorporating graphs and abstract numbers. Suitable for use in presentations or articles about economic trends, data analysis, global business solutions, and financial markets.
Powered by 


0
downloads
downloads
Tags:
More
Credit Photo
If you would like to credit the Photo, here are some ways you can do so
Text Link
photo Link
<span class="text-link">
<span>
<a target="_blank" href=https://pikwizard.com/photo/digital-financial-data-with-graphs-and-numbers-illustrations/0760cb3cf5fda274c7328378975d4284/>PikWizard</a>
</span>
</span>
<span class="image-link">
<span
style="margin: 0 0 20px 0; display: inline-block; vertical-align: middle; width: 100%;"
>
<a
target="_blank"
href="https://pikwizard.com/photo/digital-financial-data-with-graphs-and-numbers-illustrations/0760cb3cf5fda274c7328378975d4284/"
style="text-decoration: none; font-size: 10px; margin: 0;"
>
<img src="https://pikwizard.com/pw/medium/0760cb3cf5fda274c7328378975d4284.jpg" style="margin: 0; width: 100%;" alt="" />
<p style="font-size: 12px; margin: 0;">PikWizard</p>
</a>
</span>
</span>
Free (free of charge)
Free for personal and commercial use.
Author: Awesome Content
Similar Free Stock Images

Premium


Premium


Premium


Premium


Premium


Premium


Premium


Premium


Premium


Premium


Premium


Premium


Premium


Premium


Premium


Premium


Premium


Premium


Premium


Premium


Premium


Premium


Premium


Premium