- Home >
- Stock Photos >
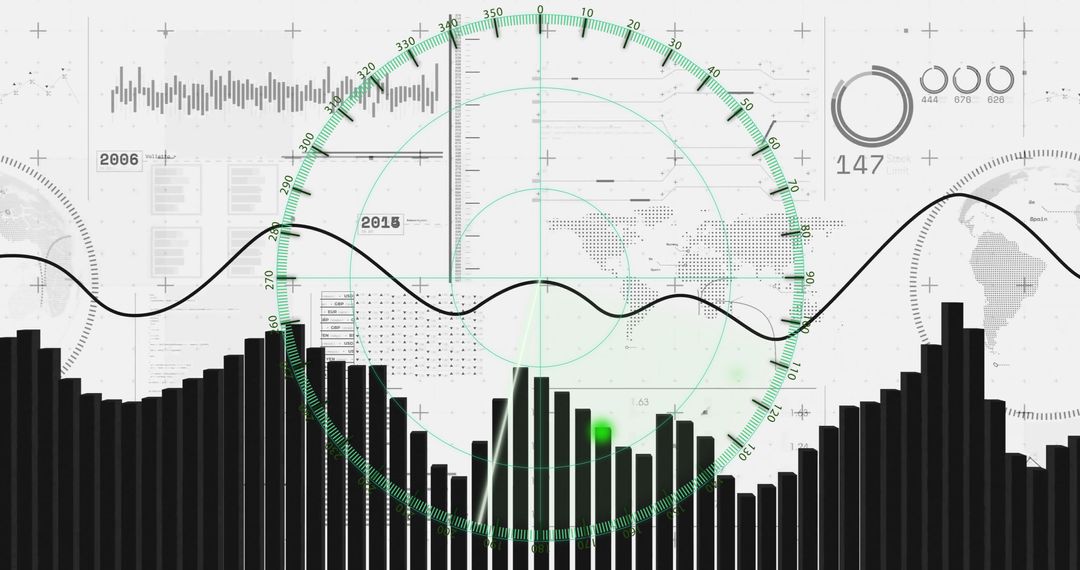
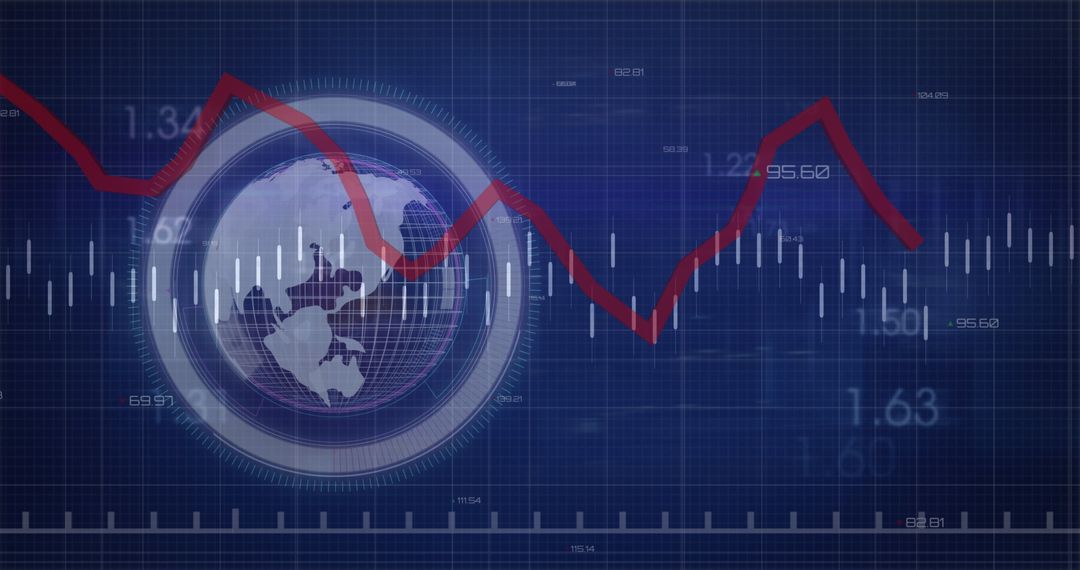
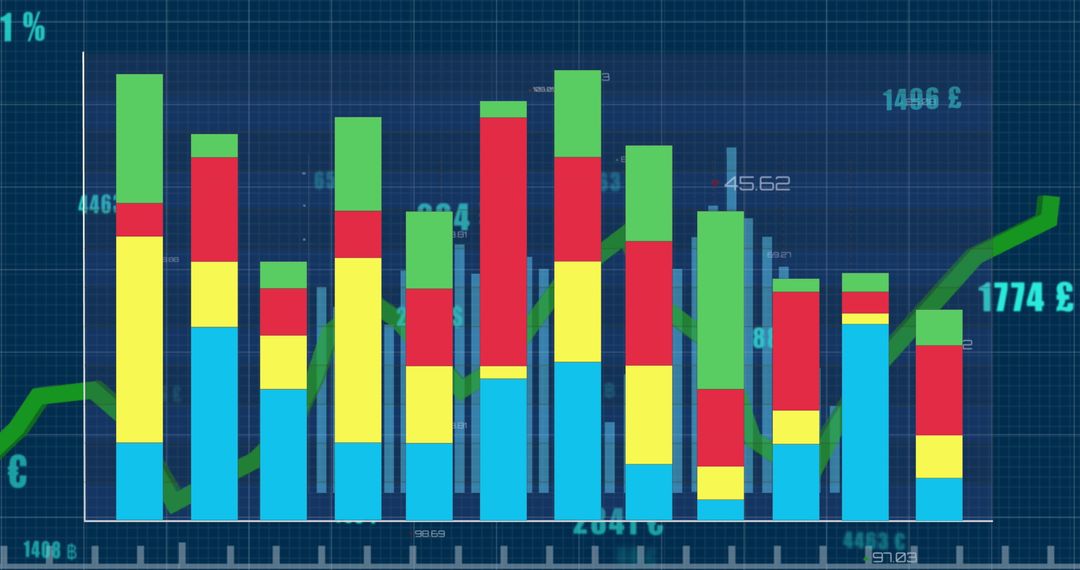
- Digital Financial Data with Graphs and Numbers on Blue Backdrop
Digital Financial Data with Graphs and Numbers on Blue Backdrop Image

Illustrates financial data processing including graphs, charts, and numeric values, offering a digital representation of financial market statistics. This can be used by businesses or financial institutions for presentations about global finance trends, digital economies, or financial planning strategies. Its futuristic theme makes it ideal for technology corporations focusing on fintech innovations.
Powered by  - Get 15% off with code: PIKWIZARD15


0
downloads
downloads
Tags:
More
Credit Photo
If you would like to credit the Photo, here are some ways you can do so
Text Link
photo Link
<span class="text-link">
<span>
<a target="_blank" href=https://pikwizard.com/photo/digital-financial-data-with-graphs-and-numbers-on-blue-backdrop/9a0f1cca7339c61bfb60a70805e09b8a/>PikWizard</a>
</span>
</span>
<span class="image-link">
<span
style="margin: 0 0 20px 0; display: inline-block; vertical-align: middle; width: 100%;"
>
<a
target="_blank"
href="https://pikwizard.com/photo/digital-financial-data-with-graphs-and-numbers-on-blue-backdrop/9a0f1cca7339c61bfb60a70805e09b8a/"
style="text-decoration: none; font-size: 10px; margin: 0;"
>
<img src="https://pikwizard.com/pw/medium/9a0f1cca7339c61bfb60a70805e09b8a.jpg" style="margin: 0; width: 100%;" alt="" />
<p style="font-size: 12px; margin: 0;">PikWizard</p>
</a>
</span>
</span>
Free (free of charge)
Free for personal and commercial use.
Author: Authentic Images
Similar Free Stock Images

Premium


Premium


Premium


Premium


Premium


Premium


Premium


Premium


Premium


Premium


Premium


Premium


Premium


Premium


Premium


Premium


Premium


Premium


Premium


Premium


Premium


Premium


Premium


Premium