
- Home >
- Stock Photos >
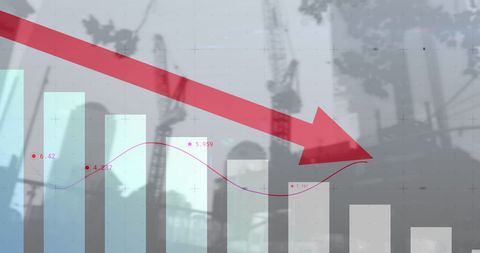
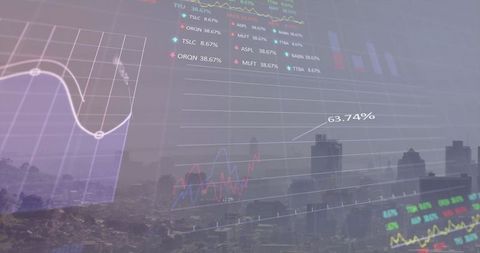
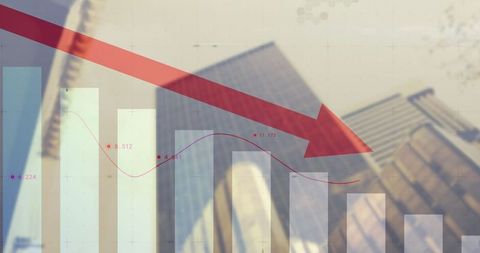
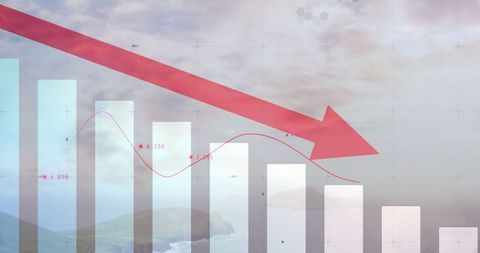
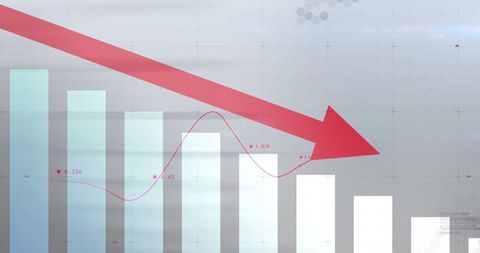
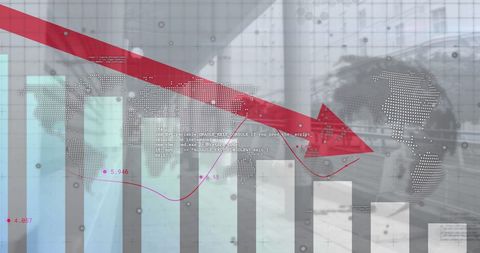
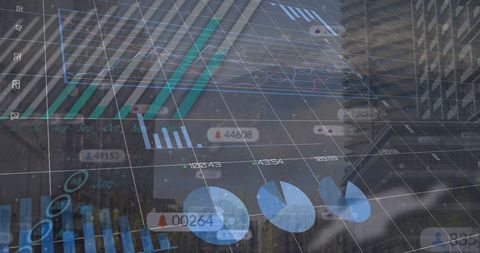
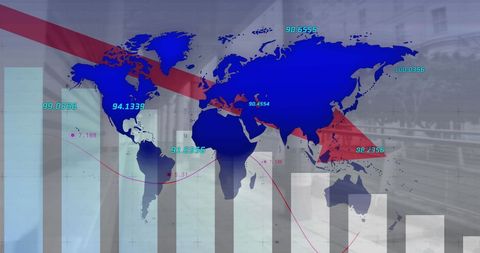
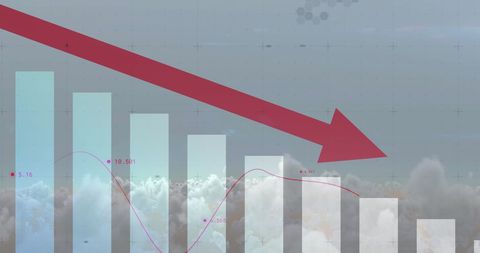
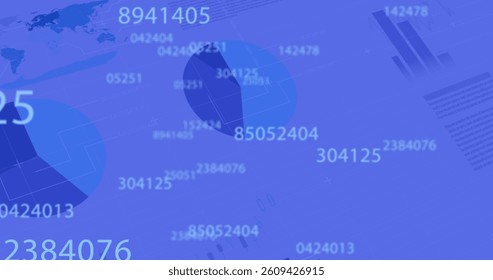
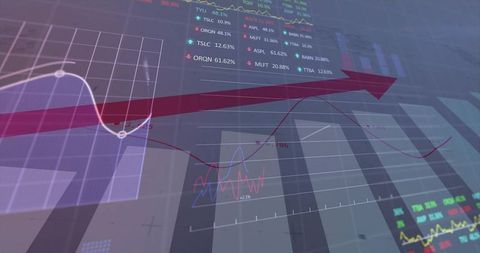
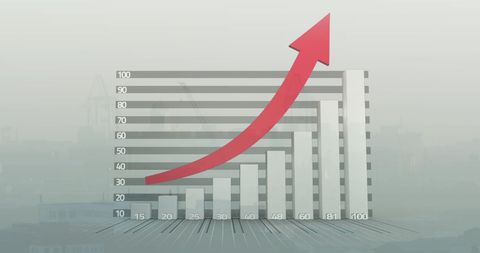
- Digital Financial Data with Rising Chart Visualization
Digital Financial Data with Rising Chart Visualization Image

Graphical elements illustrating financial data processing and analysis appear on a clean digital interface. The image includes technical graphs and a prominent red arrow indicating rising trends, making it suitable for use in financial reports, business presentations, or investment-related content focusing on data-driven decision-making and analytics.
Powered by  - Get 15% off with code: PIKWIZARD15


downloads
Tags:
More
Credit Photo
If you would like to credit the Photo, here are some ways you can do so
Text Link
photo Link
<span class="text-link">
<span>
<a target="_blank" href=https://pikwizard.com/photo/digital-financial-data-with-rising-chart-visualization/805973188226db7bbd17b38d5a995603/>PikWizard</a>
</span>
</span>
<span class="image-link">
<span
style="margin: 0 0 20px 0; display: inline-block; vertical-align: middle; width: 100%;"
>
<a
target="_blank"
href="https://pikwizard.com/photo/digital-financial-data-with-rising-chart-visualization/805973188226db7bbd17b38d5a995603/"
style="text-decoration: none; font-size: 10px; margin: 0;"
>
<img src="https://pikwizard.com/pw/medium/805973188226db7bbd17b38d5a995603.jpg" style="margin: 0; width: 100%;" alt="" />
<p style="font-size: 12px; margin: 0;">PikWizard</p>
</a>
</span>
</span>
Free (free of charge)
Free for personal and commercial use.
Author: Creative Art
Similar Free Stock Images

Premium


Premium


Premium


Premium


Premium


Premium


Premium


Premium


Premium


Premium


Premium


Premium


Premium


Premium


Premium


Premium


Premium


Premium


Premium


Premium


Premium


Premium


Premium


Premium


Premium

Explore More Free Stock Images