
- Home >
- Stock Photos >
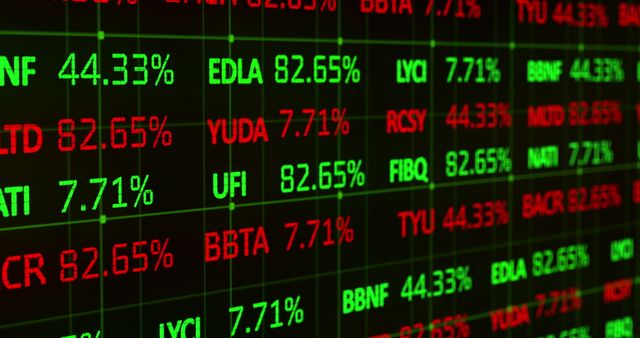
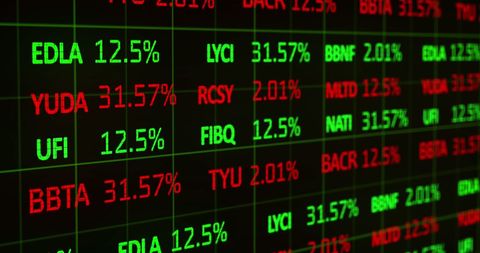
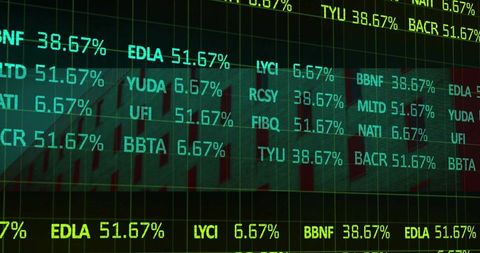
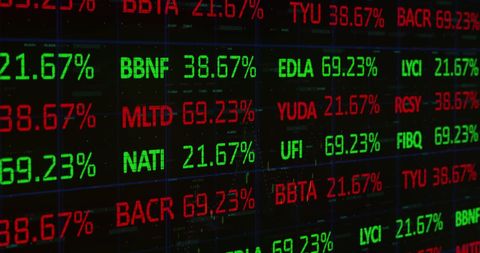
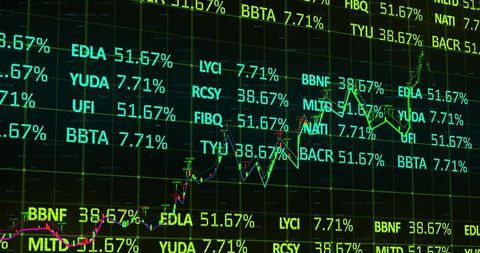
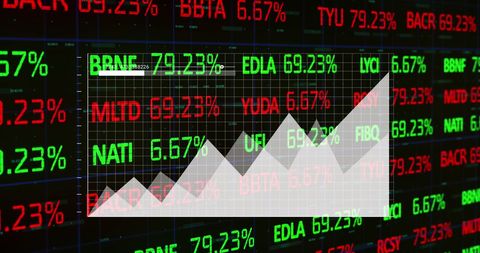
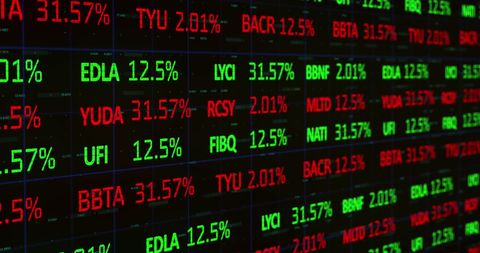
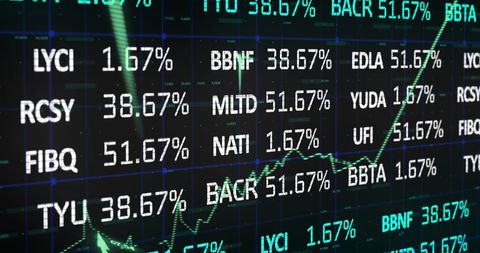
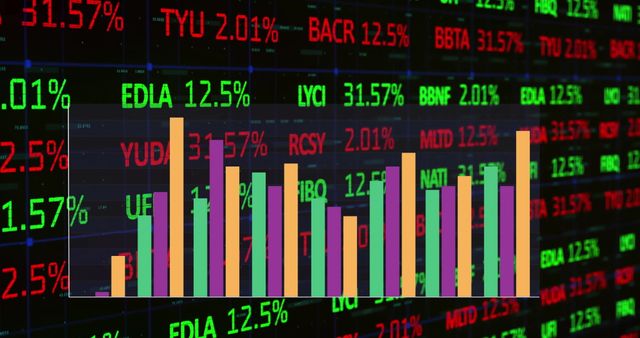
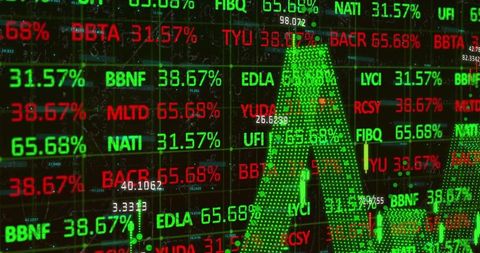
- Digital Financial Data with Stock Market Indicators
Digital Financial Data with Stock Market Indicators Image

Depiction of stock market activity with green and red financial data displayed in digital format. Useful for content related to global finance trends, business strategies, economic research, and stock market analysis. Ideal for illustrating articles on trading, investment strategies, or financial services presentations.
Powered by 


downloads
Tags:
More
Credit Photo
If you would like to credit the Photo, here are some ways you can do so
Text Link
photo Link
<span class="text-link">
<span>
<a target="_blank" href=https://pikwizard.com/photo/digital-financial-data-with-stock-market-indicators/f6052383f1ec011c693f999879e50288/>PikWizard</a>
</span>
</span>
<span class="image-link">
<span
style="margin: 0 0 20px 0; display: inline-block; vertical-align: middle; width: 100%;"
>
<a
target="_blank"
href="https://pikwizard.com/photo/digital-financial-data-with-stock-market-indicators/f6052383f1ec011c693f999879e50288/"
style="text-decoration: none; font-size: 10px; margin: 0;"
>
<img src="https://pikwizard.com/pw/medium/f6052383f1ec011c693f999879e50288.jpg" style="margin: 0; width: 100%;" alt="" />
<p style="font-size: 12px; margin: 0;">PikWizard</p>
</a>
</span>
</span>
Free (free of charge)
Free for personal and commercial use.
Author: People Creations
Similar Free Stock Images
Loading...
Premium


Premium


Premium


Premium


Premium

Premium


Premium

Premium


Premium


Premium

Premium

Premium


Premium


Premium

Premium

Premium


Premium


Premium


Premium


Premium


Premium


Premium


Premium

Premium


Premium
