
- Home >
- Stock Photos >
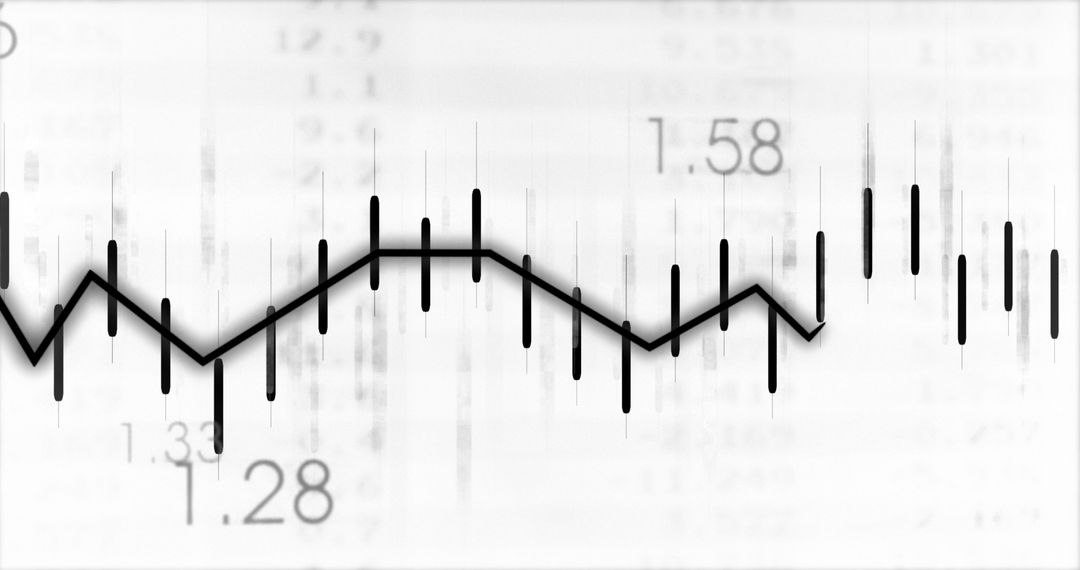
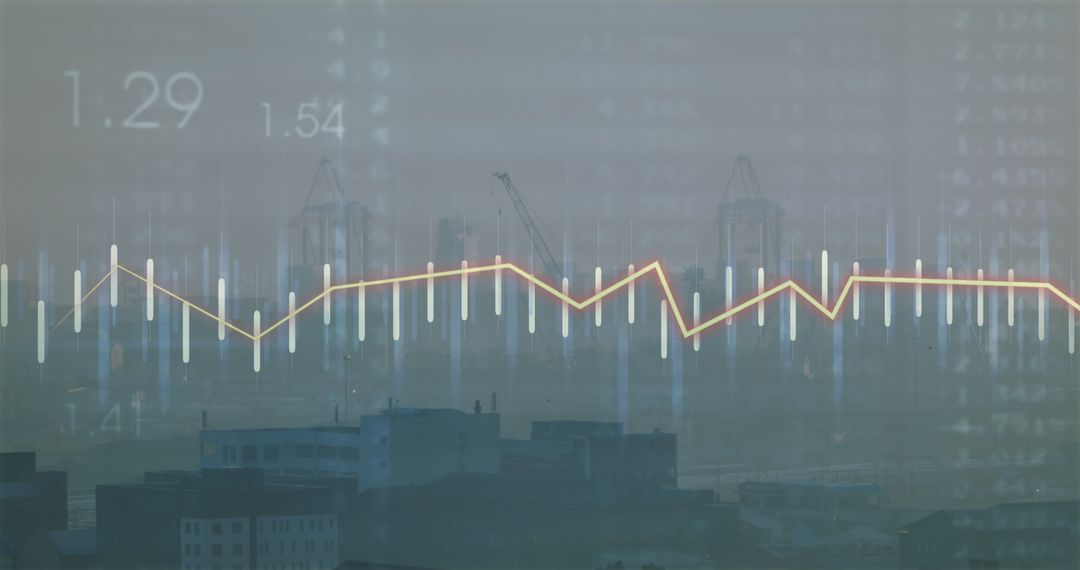
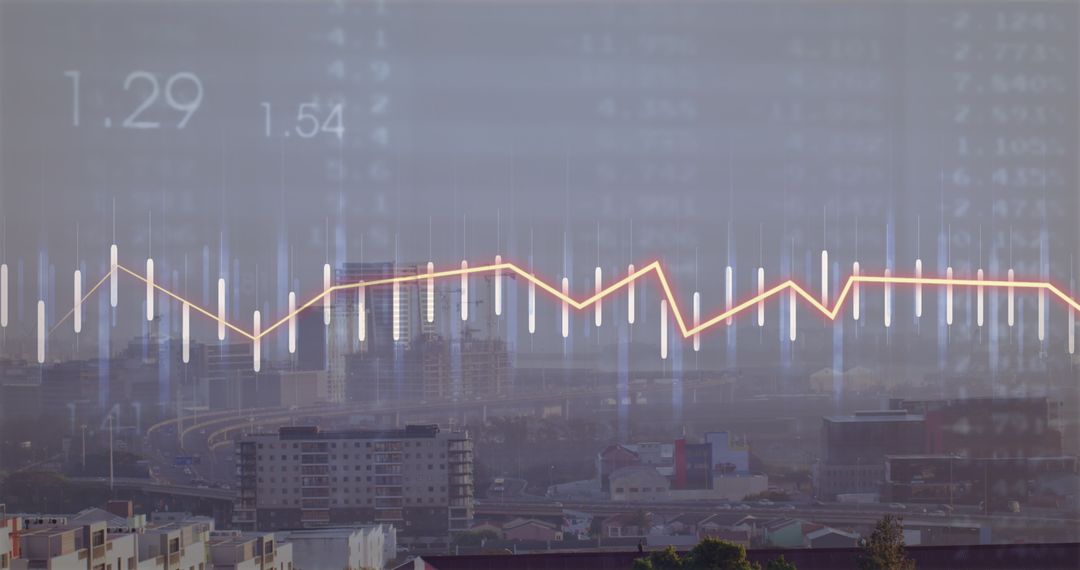
- Digital Financial Graph and Data Display on Blue Background
Digital Financial Graph and Data Display on Blue Background Image

The image shows a digital display of economic data, featuring a graph representing market trends over a blue background. This concept is often associated with business analysis, financial research, and investment strategies. Perfect for topics related to financial markets, technological integrations in business, and economic forecasting.
Powered by  - Get 15% off with code: PIKWIZARD15


2
downloads
downloads
Tags:
More
Credit Photo
If you would like to credit the Photo, here are some ways you can do so
Text Link
photo Link
<span class="text-link">
<span>
<a target="_blank" href=https://pikwizard.com/photo/digital-financial-graph-and-data-display-on-blue-background/6962c6a33cd66793a42bff15be19a7f8/>PikWizard</a>
</span>
</span>
<span class="image-link">
<span
style="margin: 0 0 20px 0; display: inline-block; vertical-align: middle; width: 100%;"
>
<a
target="_blank"
href="https://pikwizard.com/photo/digital-financial-graph-and-data-display-on-blue-background/6962c6a33cd66793a42bff15be19a7f8/"
style="text-decoration: none; font-size: 10px; margin: 0;"
>
<img src="https://pikwizard.com/pw/medium/6962c6a33cd66793a42bff15be19a7f8.jpg" style="margin: 0; width: 100%;" alt="" />
<p style="font-size: 12px; margin: 0;">PikWizard</p>
</a>
</span>
</span>
Free (free of charge)
Free for personal and commercial use.
Author: Authentic Images
Similar Free Stock Images

Premium


Premium


Premium


Premium


Premium


Premium


Premium


Premium


Premium


Premium


Premium


Premium


Premium


Premium


Premium


Premium


Premium


Premium


Premium


Premium


Premium


Premium


Premium


Premium

