- Home >
- Stock Photos >
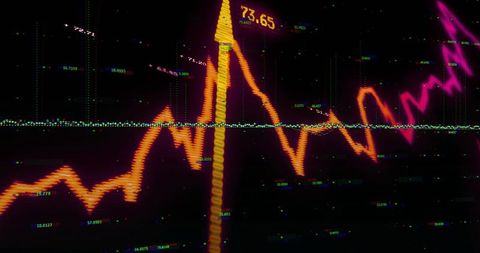
- Digital Financial Graph on Green Background Showing Rising Trends
Digital Financial Graph on Green Background Showing Rising Trends Image

Glowing financial graph on a green grid background conveys data trends and economic insights. Suitable for producers of content centered on finance, technology, and data analysis. Ideal for websites, blogs, and presentations discussing market trends, financial analysis, or stock performance.
Powered by  - Get 15% off with code: PIKWIZARD15


downloads
Tags:
More
Credit Photo
If you would like to credit the Photo, here are some ways you can do so
Text Link
photo Link
<span class="text-link">
<span>
<a target="_blank" href=https://pikwizard.com/photo/digital-financial-graph-on-green-background-showing-rising-trends/3564209fc2eecb35df1bcb35417fff66/>PikWizard</a>
</span>
</span>
<span class="image-link">
<span
style="margin: 0 0 20px 0; display: inline-block; vertical-align: middle; width: 100%;"
>
<a
target="_blank"
href="https://pikwizard.com/photo/digital-financial-graph-on-green-background-showing-rising-trends/3564209fc2eecb35df1bcb35417fff66/"
style="text-decoration: none; font-size: 10px; margin: 0;"
>
<img src="https://pikwizard.com/pw/medium/3564209fc2eecb35df1bcb35417fff66.jpg" style="margin: 0; width: 100%;" alt="" />
<p style="font-size: 12px; margin: 0;">PikWizard</p>
</a>
</span>
</span>
Free (free of charge)
Free for personal and commercial use.
Author: Creative Art
Similar Free Stock Images
Loading...

Premium


Premium


Premium


Premium


Premium


Premium


Premium

Premium


Premium


Premium


Premium


Premium


Premium


Premium


Premium


Premium


Premium


Premium


Premium


Premium

Premium


Premium


Premium


Premium


Premium