- Home >
- Stock Photos >
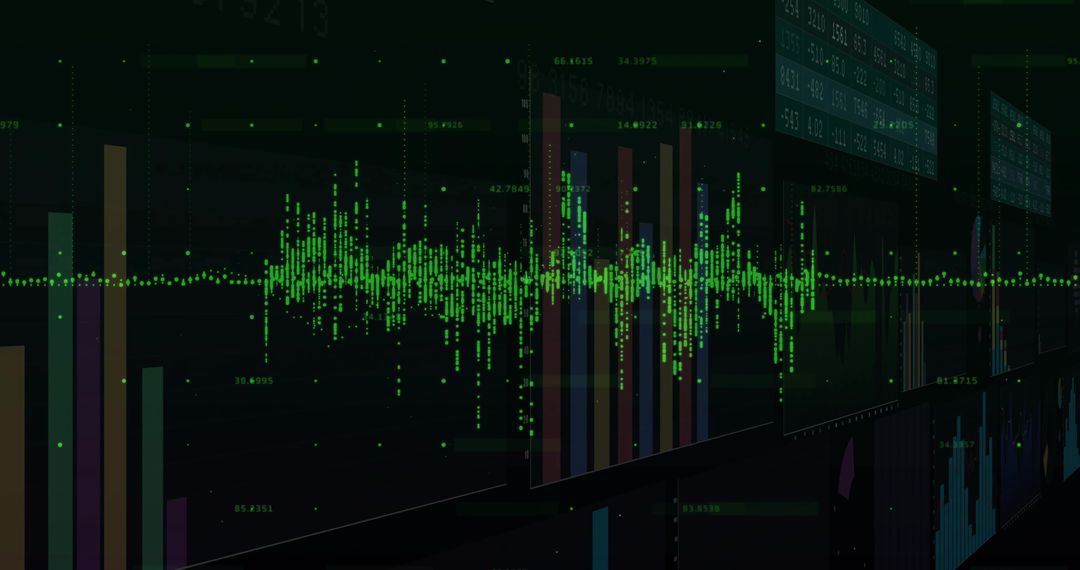
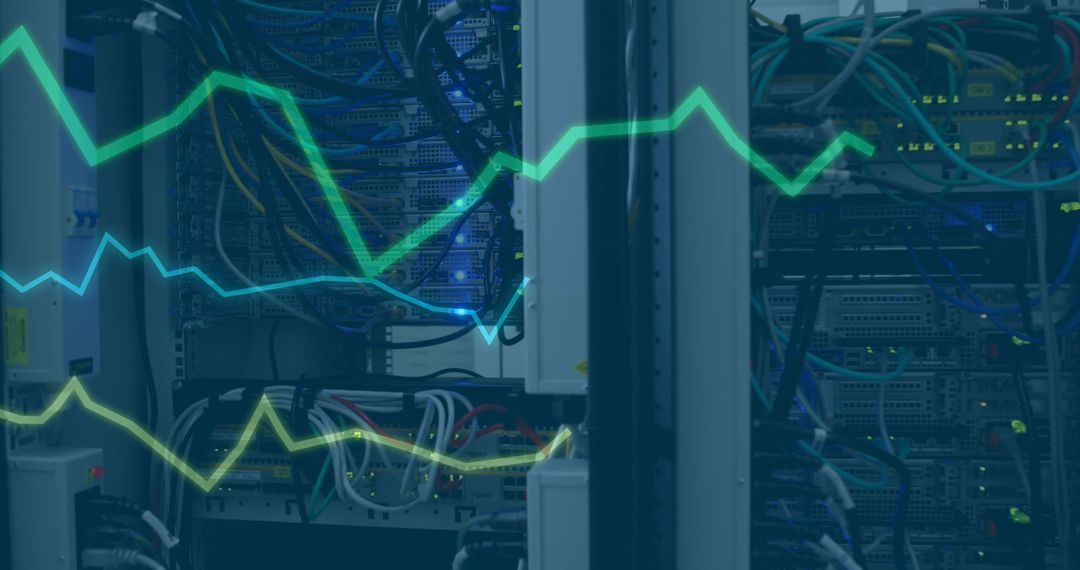
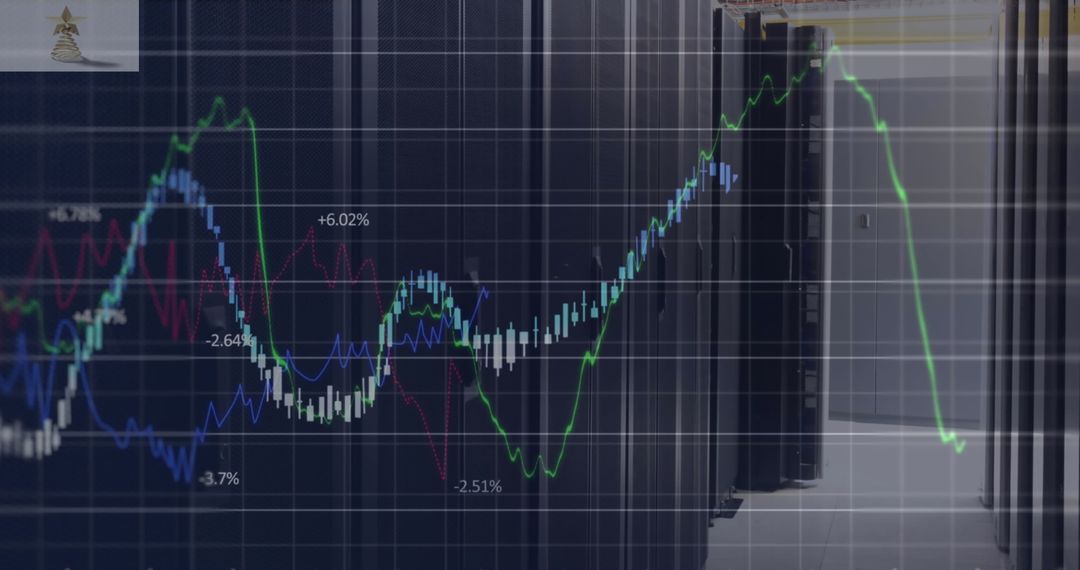
- Digital Financial Graph Overlay on Data Center Servers
Digital Financial Graph Overlay on Data Center Servers Image
Dynamic digital representation of a financial graph overlaid on data center servers, symbolizing the intersection of finance and technology. Suitable for illustrating concepts related to big data, digital communications in financial technology, or enterprise server operations. Useful for articles or publications on digital finance, big data analytics, and global communications infrastructure.
Powered by 


0
downloads
downloads
Tags:
More
Credit Photo
If you would like to credit the Photo, here are some ways you can do so
Text Link
photo Link
<span class="text-link">
<span>
<a target="_blank" href=https://pikwizard.com/photo/digital-financial-graph-overlay-on-data-center-servers/39bb0f9461a11568827a8abf9d6b1883/>PikWizard</a>
</span>
</span>
<span class="image-link">
<span
style="margin: 0 0 20px 0; display: inline-block; vertical-align: middle; width: 100%;"
>
<a
target="_blank"
href="https://pikwizard.com/photo/digital-financial-graph-overlay-on-data-center-servers/39bb0f9461a11568827a8abf9d6b1883/"
style="text-decoration: none; font-size: 10px; margin: 0;"
>
<img src="https://pikwizard.com/pw/medium/39bb0f9461a11568827a8abf9d6b1883.jpg" style="margin: 0; width: 100%;" alt="" />
<p style="font-size: 12px; margin: 0;">PikWizard</p>
</a>
</span>
</span>
Free (free of charge)
Free for personal and commercial use.
Author: People Creations
Similar Free Stock Images

Premium


Premium


Premium


Premium


Premium


Premium


Premium


Premium


Premium


Premium


Premium


Premium


Premium


Premium


Premium


Premium


Premium


Premium


Premium


Premium


Premium


Premium


Premium


Premium