
- Home >
- Stock Photos >
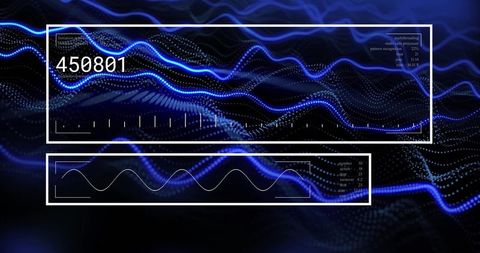
- Digital Financial Graph Waves Overlay High-Tech Theme
Digital Financial Graph Waves Overlay High-Tech Theme Image

Digital finances concept with overlay waves interacting with bar graph on blue background. Perfect for presentations in economics and finance. Great for illustrating data analysis, technological enterprise, and dynamic changes in markets. Useful in academic settings, reports, or futuristic-themed projects to exemplify data insight and financial trends.
Powered by  - Get 15% off with code: PIKWIZARD15


downloads
Tags:
More
Credit Photo
If you would like to credit the Photo, here are some ways you can do so
Text Link
photo Link
<span class="text-link">
<span>
<a target="_blank" href=https://pikwizard.com/photo/digital-financial-graph-waves-overlay-high-tech-theme/ad70122d6f035c3d6286cb5ad006b755/>PikWizard</a>
</span>
</span>
<span class="image-link">
<span
style="margin: 0 0 20px 0; display: inline-block; vertical-align: middle; width: 100%;"
>
<a
target="_blank"
href="https://pikwizard.com/photo/digital-financial-graph-waves-overlay-high-tech-theme/ad70122d6f035c3d6286cb5ad006b755/"
style="text-decoration: none; font-size: 10px; margin: 0;"
>
<img src="https://pikwizard.com/pw/medium/ad70122d6f035c3d6286cb5ad006b755.jpg" style="margin: 0; width: 100%;" alt="" />
<p style="font-size: 12px; margin: 0;">PikWizard</p>
</a>
</span>
</span>
Free (free of charge)
Free for personal and commercial use.
Author: Creative Art
Similar Free Stock Images

Premium


Premium

Premium


Premium


Premium

Premium

Premium


Premium


Premium

Premium

Premium

Premium


Premium


Premium


Premium

Premium

Premium


Premium

Premium


Premium

Premium


Premium


Premium

Premium


Premium


Explore More Free Stock Images