
- Home >
- Stock Photos >
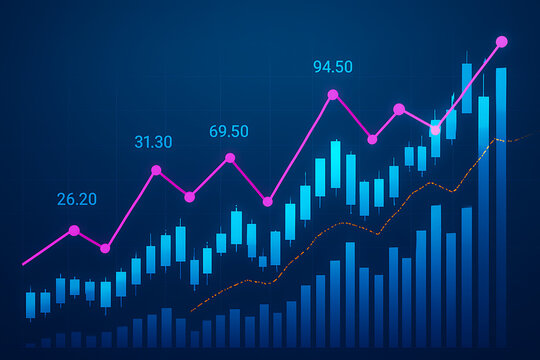
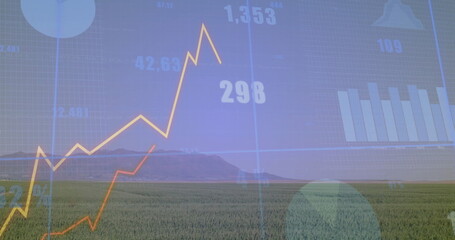
- Digital Financial Graph with Numerical Analysis Interface
Digital Financial Graph with Numerical Analysis Interface Image

Dynamic visualization suitable for presentations on market trends, webinars focusing on financial technology, or articles about economic analysis. Ideal for illustrating the synergy between data representation and digital analytics in a modern business environment.
Powered by 


downloads
Tags:
More
Credit Photo
If you would like to credit the Photo, here are some ways you can do so
Text Link
photo Link
<span class="text-link">
<span>
<a target="_blank" href=https://pikwizard.com/photo/digital-financial-graph-with-numerical-analysis-interface/5de71de9f46ba854e59a885de31eae96/>PikWizard</a>
</span>
</span>
<span class="image-link">
<span
style="margin: 0 0 20px 0; display: inline-block; vertical-align: middle; width: 100%;"
>
<a
target="_blank"
href="https://pikwizard.com/photo/digital-financial-graph-with-numerical-analysis-interface/5de71de9f46ba854e59a885de31eae96/"
style="text-decoration: none; font-size: 10px; margin: 0;"
>
<img src="https://pikwizard.com/pw/medium/5de71de9f46ba854e59a885de31eae96.jpg" style="margin: 0; width: 100%;" alt="" />
<p style="font-size: 12px; margin: 0;">PikWizard</p>
</a>
</span>
</span>
Free (free of charge)
Free for personal and commercial use.
Author: Awesome Content
Similar Free Stock Images

Premium


Premium


Premium


Premium


Premium


Premium


Premium


Premium


Premium


Premium


Premium


Premium


Premium


Premium


Premium


Premium


Premium

Premium


Premium

Premium


Premium


Premium

Premium


Premium


Premium


Explore More Free Stock Images