- Home >
- Stock Photos >
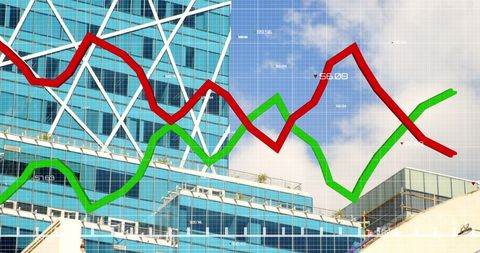
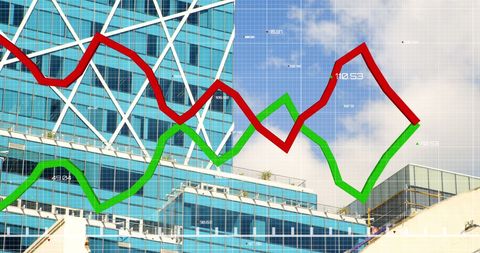
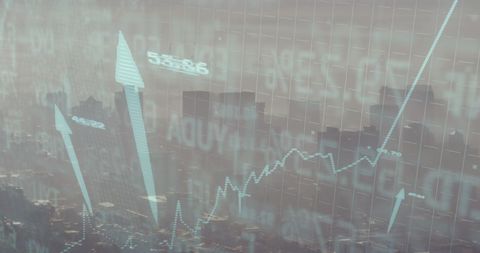
- Digital Financial Graphs and Binary Code on Blue Background
Digital Financial Graphs and Binary Code on Blue Background Image

This vibrant digital illustration combines financial graphs, binary code, and a blue background, representing the intersection of technology and economics. Ideal for projects on global finance trends, technological advancements in data processing, and market networking. Useful for economic research articles, tech-infused financial content actively explaining market analysis and broader tech implications in finance sectors.

downloads
Tags:
More
Credit Photo
If you would like to credit the Photo, here are some ways you can do so
Text Link
photo Link
<span class="text-link">
<span>
<a target="_blank" href=https://pikwizard.com/photo/digital-financial-graphs-and-binary-code-on-blue-background/df71b03c52327e5c2e93f4ebc26bafeb/>PikWizard</a>
</span>
</span>
<span class="image-link">
<span
style="margin: 0 0 20px 0; display: inline-block; vertical-align: middle; width: 100%;"
>
<a
target="_blank"
href="https://pikwizard.com/photo/digital-financial-graphs-and-binary-code-on-blue-background/df71b03c52327e5c2e93f4ebc26bafeb/"
style="text-decoration: none; font-size: 10px; margin: 0;"
>
<img src="https://pikwizard.com/pw/medium/df71b03c52327e5c2e93f4ebc26bafeb.jpg" style="margin: 0; width: 100%;" alt="" />
<p style="font-size: 12px; margin: 0;">PikWizard</p>
</a>
</span>
</span>
Free (free of charge)
Free for personal and commercial use.
Author: People Creations