
- Home >
- Stock Photos >
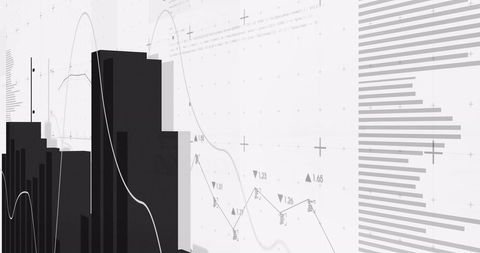
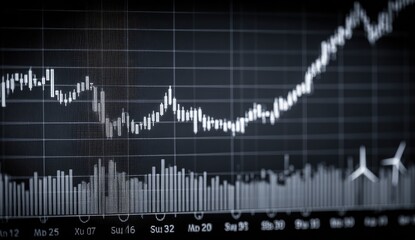
- Digital Financial Graphs and Data Analysis Background
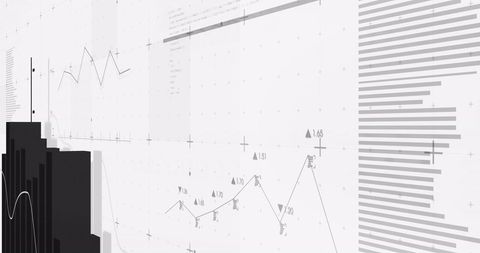
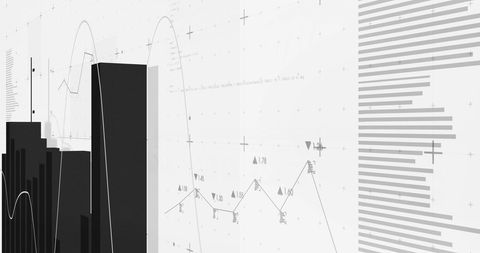
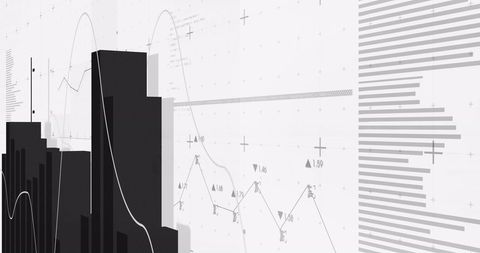
Digital Financial Graphs and Data Analysis Background Image

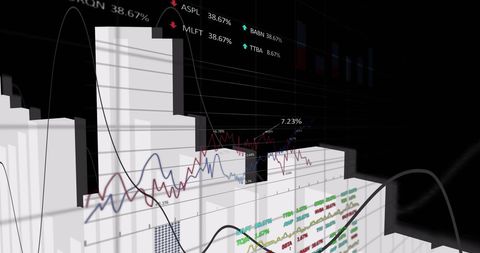
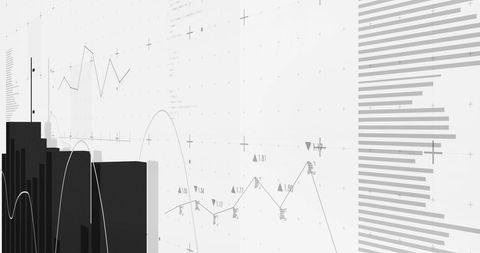
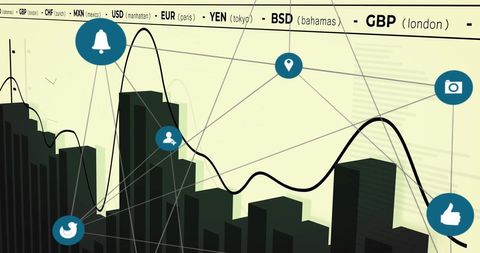
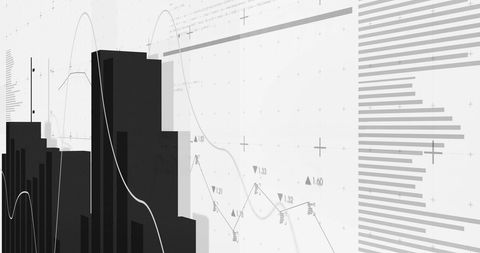
Abstract financial data and graphs with black bars and line charts overlaying a white background symbolizes digital analytics and business processing. Ideal for use in financial presentations, reports, economic infographics, and teaching resources about data analysis and technology in modern business practices.
Powered by 


downloads
Tags:
More
Credit Photo
If you would like to credit the Photo, here are some ways you can do so
Text Link
photo Link
<span class="text-link">
<span>
<a target="_blank" href=https://pikwizard.com/photo/digital-financial-graphs-and-data-analysis-background/c550ff322783577b6e1cc0359eec3629/>PikWizard</a>
</span>
</span>
<span class="image-link">
<span
style="margin: 0 0 20px 0; display: inline-block; vertical-align: middle; width: 100%;"
>
<a
target="_blank"
href="https://pikwizard.com/photo/digital-financial-graphs-and-data-analysis-background/c550ff322783577b6e1cc0359eec3629/"
style="text-decoration: none; font-size: 10px; margin: 0;"
>
<img src="https://pikwizard.com/pw/medium/c550ff322783577b6e1cc0359eec3629.jpg" style="margin: 0; width: 100%;" alt="" />
<p style="font-size: 12px; margin: 0;">PikWizard</p>
</a>
</span>
</span>
Free (free of charge)
Free for personal and commercial use.
Author: Authentic Images
Similar Free Stock Images

Premium


Premium


Premium


Premium


Premium

Premium


Premium


Premium


Premium

Premium


Premium


Premium


Premium


Premium
Premium


Premium

Premium


Premium


Premium


Premium


Premium


Premium

Premium


Premium


Explore More Free Stock Images