
- Home >
- Stock Photos >
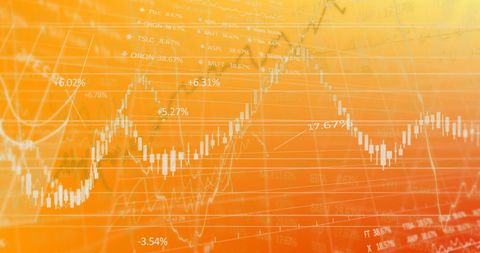
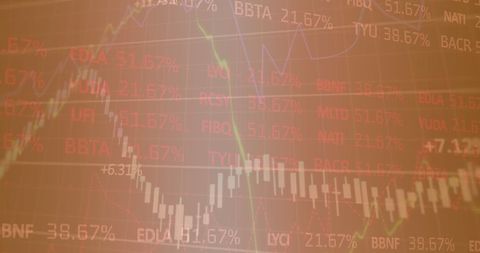
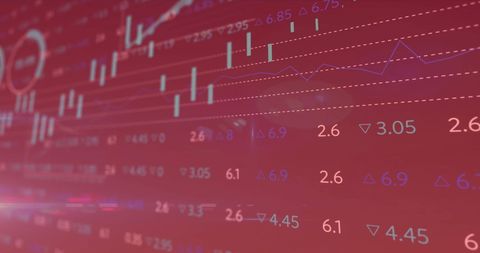
- Digital Financial Graphs and Data Visualization on Red Background
Digital Financial Graphs and Data Visualization on Red Background Image

This abstract image showcases overlapping financial graphs and data visualization elements on a red background, creating a futuristic and digital feel. Perfect for use in financial, business, or technology publications to symbolically represent economic data analysis, stock market trends, or progress tracking. Additionally, it is suitable for business presentations and reports focusing on financial growth or prediction analytics.
Powered by  - Get 15% off with code: PIKWIZARD15


downloads
Tags:
More
Credit Photo
If you would like to credit the Photo, here are some ways you can do so
Text Link
photo Link
<span class="text-link">
<span>
<a target="_blank" href=https://pikwizard.com/photo/digital-financial-graphs-and-data-visualization-on-red-background/53d9884928a221bd39162abb9e31b103/>PikWizard</a>
</span>
</span>
<span class="image-link">
<span
style="margin: 0 0 20px 0; display: inline-block; vertical-align: middle; width: 100%;"
>
<a
target="_blank"
href="https://pikwizard.com/photo/digital-financial-graphs-and-data-visualization-on-red-background/53d9884928a221bd39162abb9e31b103/"
style="text-decoration: none; font-size: 10px; margin: 0;"
>
<img src="https://pikwizard.com/pw/medium/53d9884928a221bd39162abb9e31b103.jpg" style="margin: 0; width: 100%;" alt="" />
<p style="font-size: 12px; margin: 0;">PikWizard</p>
</a>
</span>
</span>
Free (free of charge)
Free for personal and commercial use.
Author: People Creations
Similar Free Stock Images

Premium


Premium

Premium


Premium


Premium


Premium


Premium


Premium

Premium


Premium


Premium


Premium


Premium


Premium


Premium


Premium


Premium


Premium


Premium

Premium


Premium

Premium

Premium


Premium


Premium
Explore More Free Stock Images