- Home >
- Stock Photos >
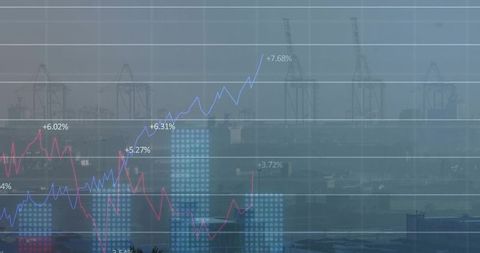
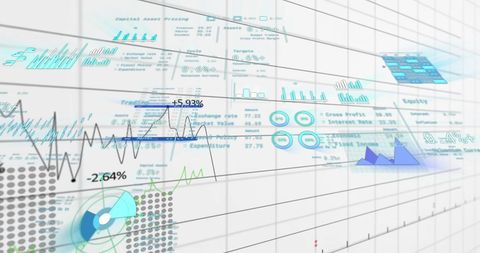
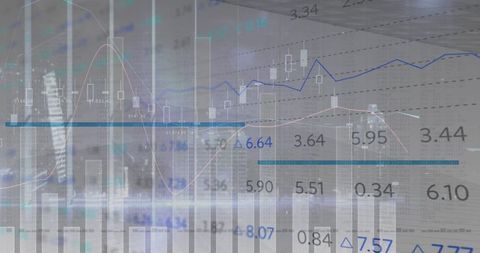
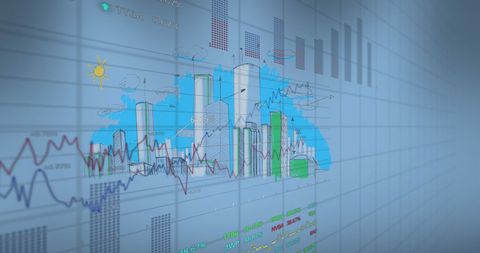
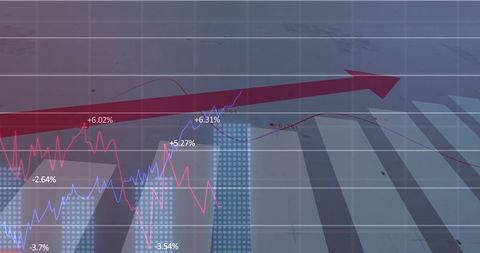
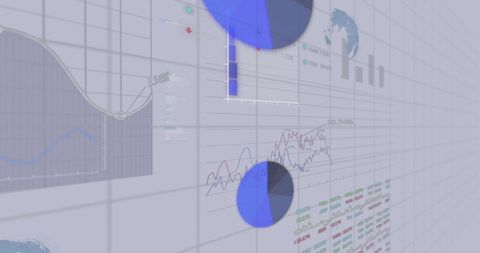
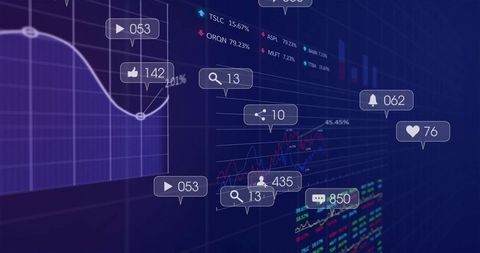
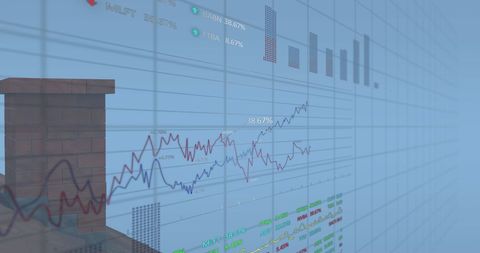
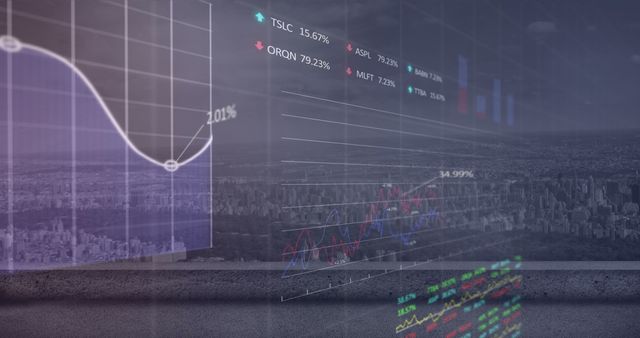
- Digital Financial Graphs and Data Visualization
Digital Financial Graphs and Data Visualization Image
Digital graphics showcase multiple financial charts and data analytics. Visualization combines line graphs and bar graphs against grey background representing economic and financial concepts. Useful for financial presentations, technology articles, data analysis reports, investment strategies, and educational materials regarding market trends and economic forecasting.

downloads
Tags:
More
Credit Photo
If you would like to credit the Photo, here are some ways you can do so
Text Link
photo Link
<span class="text-link">
<span>
<a target="_blank" href=https://pikwizard.com/photo/digital-financial-graphs-and-data-visualization/7e6473cfec7cda5b622509d06a7911ec/>PikWizard</a>
</span>
</span>
<span class="image-link">
<span
style="margin: 0 0 20px 0; display: inline-block; vertical-align: middle; width: 100%;"
>
<a
target="_blank"
href="https://pikwizard.com/photo/digital-financial-graphs-and-data-visualization/7e6473cfec7cda5b622509d06a7911ec/"
style="text-decoration: none; font-size: 10px; margin: 0;"
>
<img src="https://pikwizard.com/pw/medium/7e6473cfec7cda5b622509d06a7911ec.jpg" style="margin: 0; width: 100%;" alt="" />
<p style="font-size: 12px; margin: 0;">PikWizard</p>
</a>
</span>
</span>
Free (free of charge)
Free for personal and commercial use.
Author: Authentic Images