- Home >
- Stock Photos >
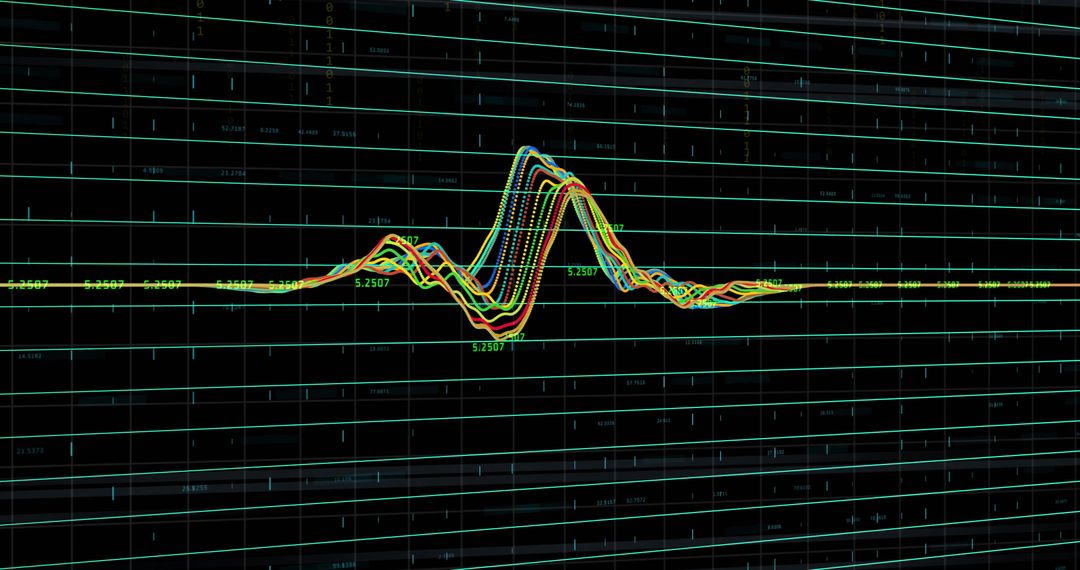
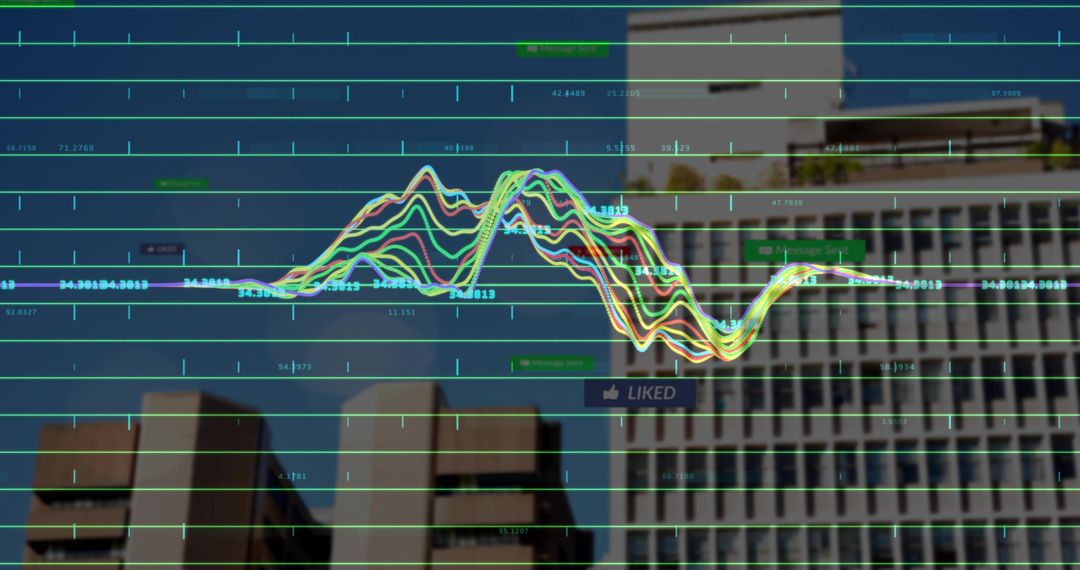
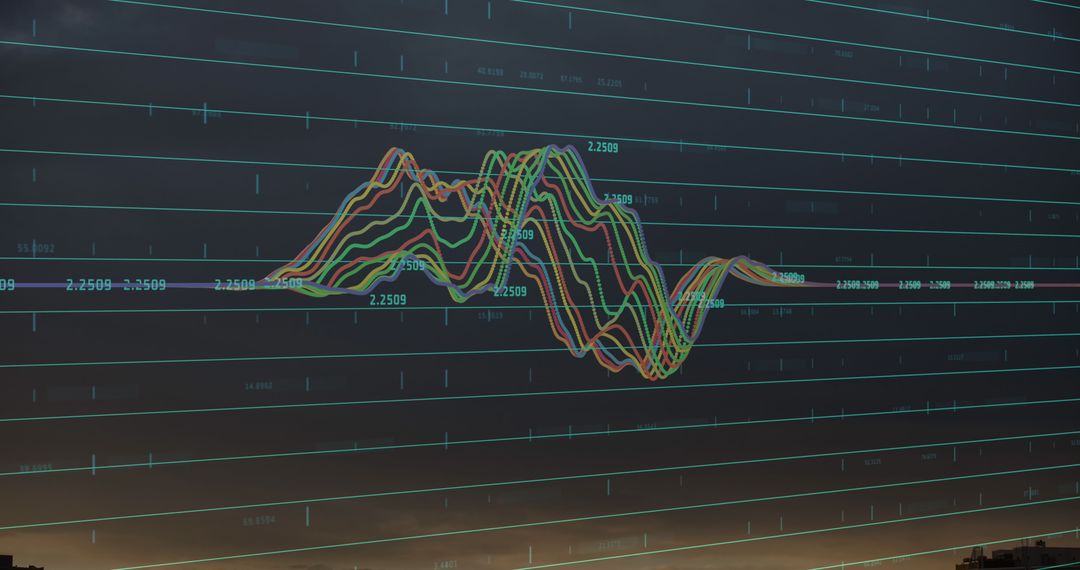
- Digital Financial Graphs and Market Data Analysis
Digital Financial Graphs and Market Data Analysis Image

Complex digital graphics of fluctuating data streams represent key financial concepts relating to market analysis and economic data trends. Ideal for illustrating finance, technology, or economics-related topics, such visuals are useful in presentations about investment strategies or economic forecasts.
Powered by 


0
downloads
downloads
Tags:
More
Credit Photo
If you would like to credit the Photo, here are some ways you can do so
Text Link
photo Link
<span class="text-link">
<span>
<a target="_blank" href=https://pikwizard.com/photo/digital-financial-graphs-and-market-data-analysis/1506eada486907433113a3d3a50e0752/>PikWizard</a>
</span>
</span>
<span class="image-link">
<span
style="margin: 0 0 20px 0; display: inline-block; vertical-align: middle; width: 100%;"
>
<a
target="_blank"
href="https://pikwizard.com/photo/digital-financial-graphs-and-market-data-analysis/1506eada486907433113a3d3a50e0752/"
style="text-decoration: none; font-size: 10px; margin: 0;"
>
<img src="https://pikwizard.com/pw/medium/1506eada486907433113a3d3a50e0752.jpg" style="margin: 0; width: 100%;" alt="" />
<p style="font-size: 12px; margin: 0;">PikWizard</p>
</a>
</span>
</span>
Free (free of charge)
Free for personal and commercial use.
Author: People Creations
Similar Free Stock Images

Premium


Premium


Premium


Premium


Premium


Premium


Premium


Premium


Premium


Premium


Premium


Premium


Premium


Premium


Premium


Premium


Premium


Premium


Premium


Premium


Premium


Premium


Premium


Premium