- Home >
- Stock Photos >
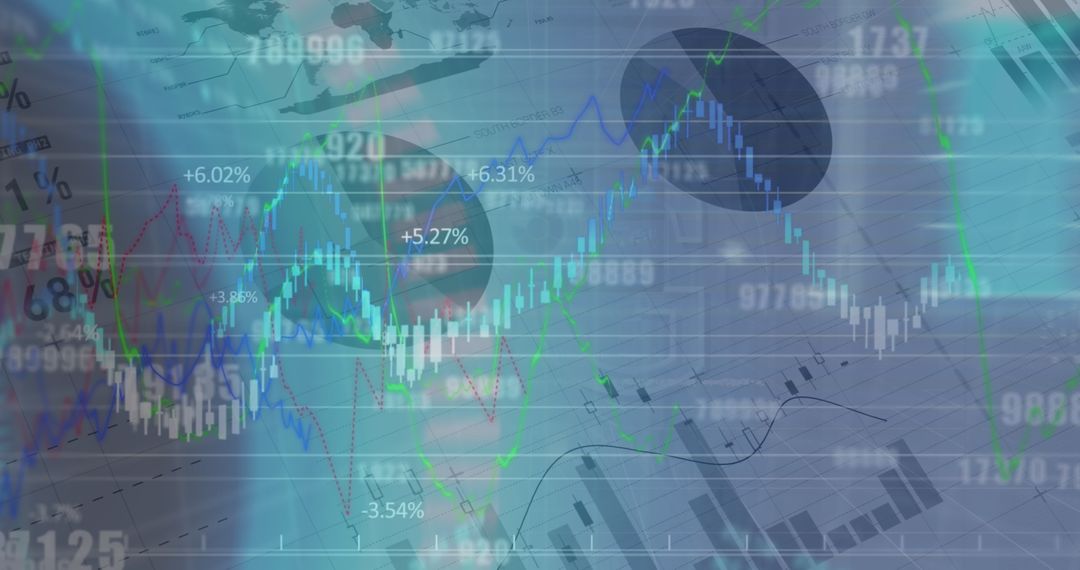
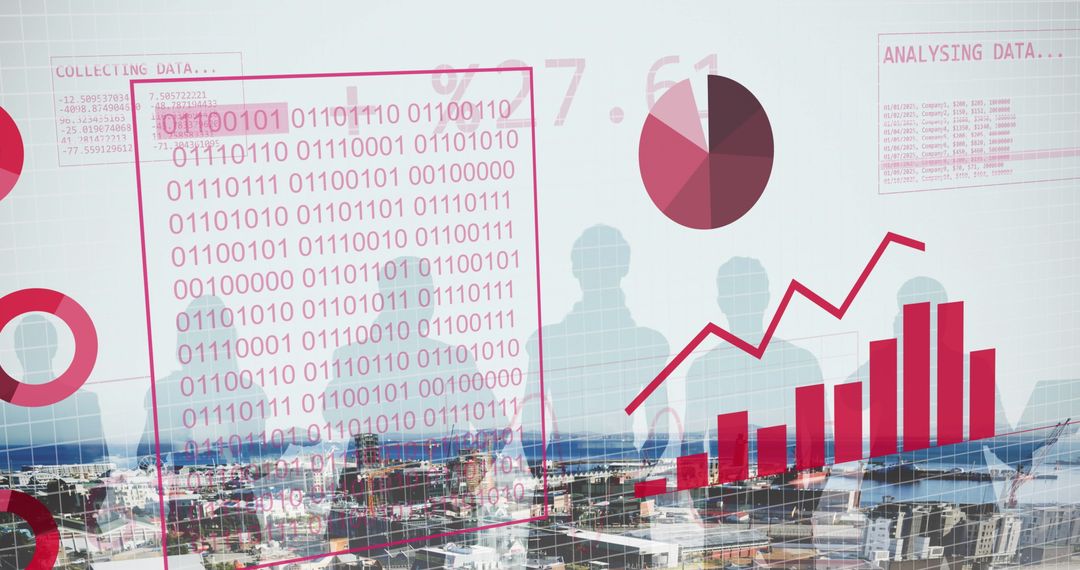
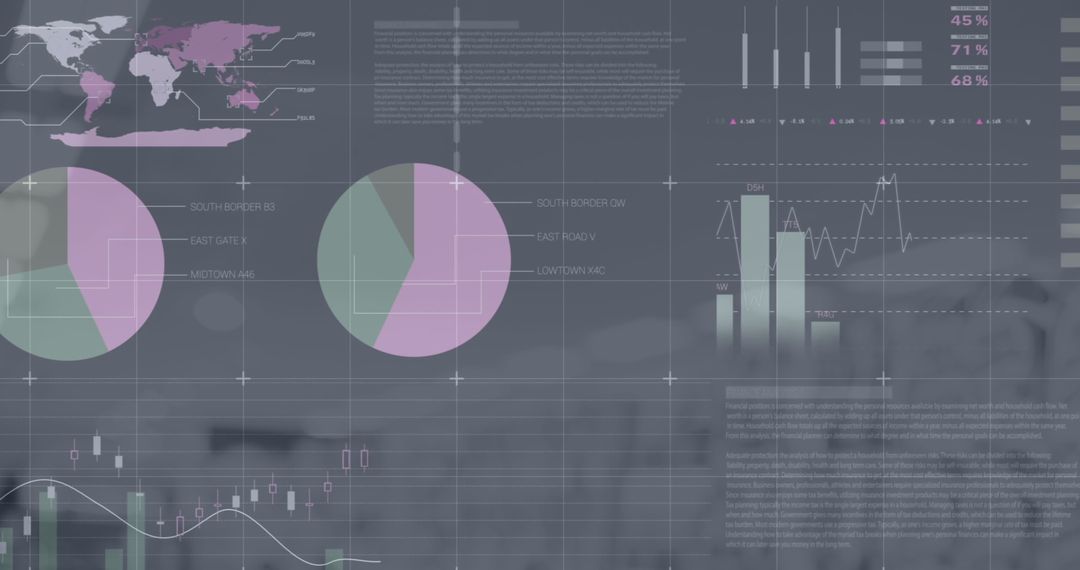
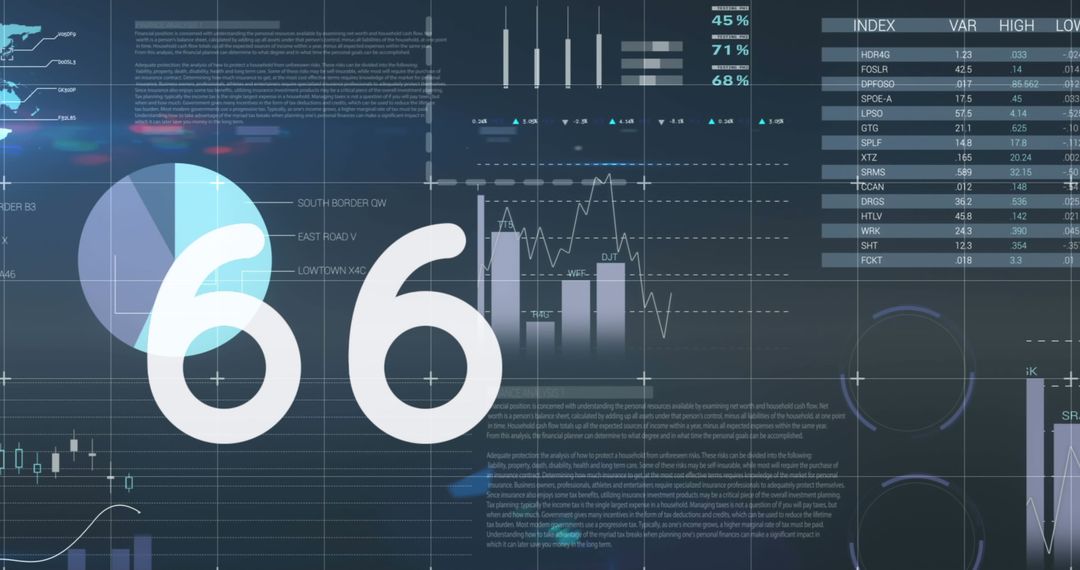
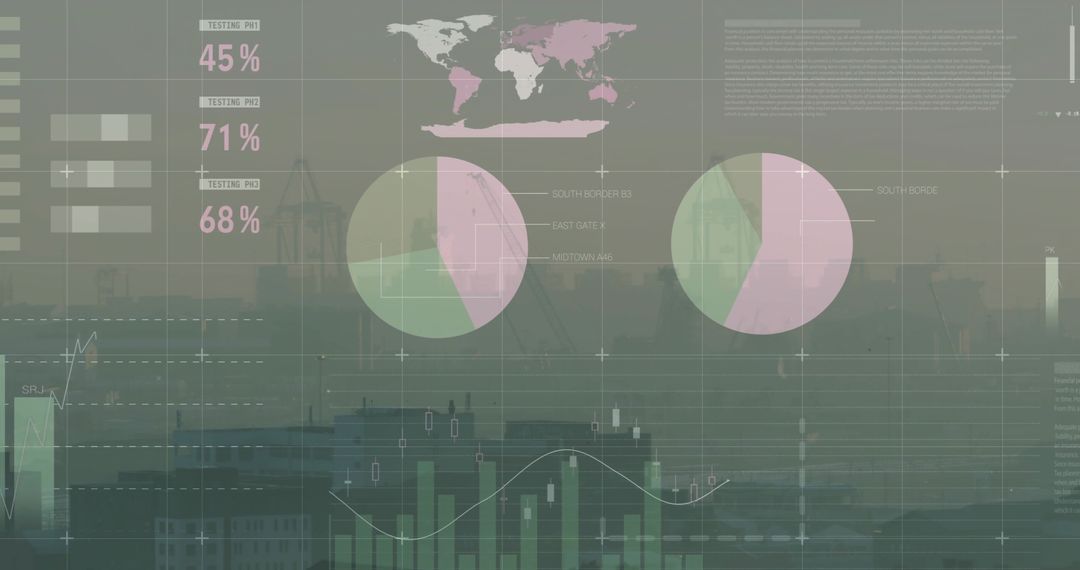
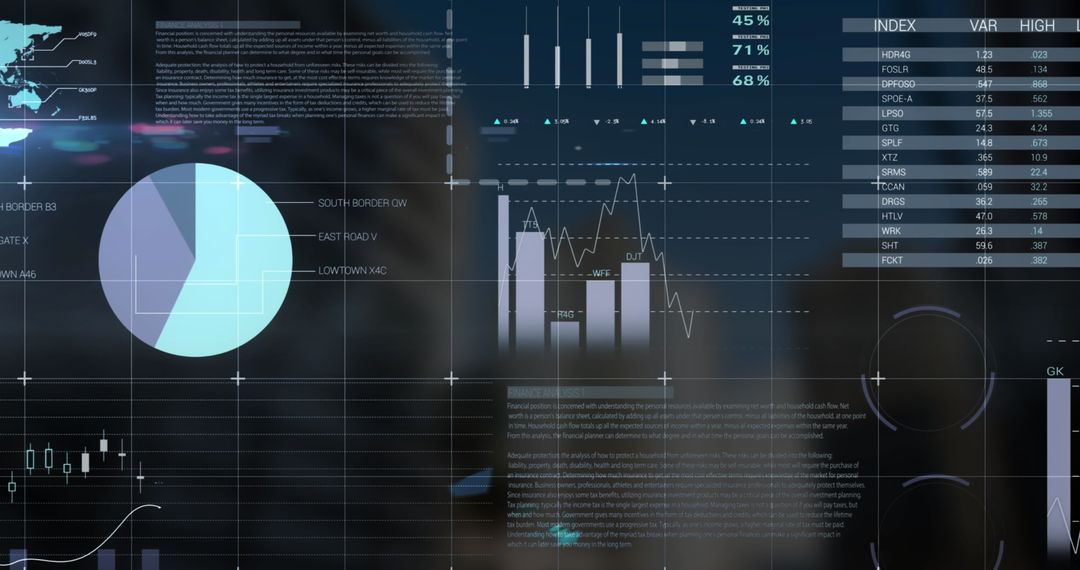
- Digital Financial Graphs and Statistics with Dynamic Symbols
Digital Financial Graphs and Statistics with Dynamic Symbols Image

This visualization contains digital graphs and fluctuating statistical data on a dynamic interface with abstract symbols completing the futuristic design. Useful for digital marketing materials about finance or technology, this mass of data representation illustratively reflects advanced analytics ideals and promises protections in this decade standing arm in arm with such scenes visually resourcing deeper insight advertisements reaching growth sectors catching up to increasing equals shares.
Powered by 


2
downloads
downloads
Tags:
More
Credit Photo
If you would like to credit the Photo, here are some ways you can do so
Text Link
photo Link
<span class="text-link">
<span>
<a target="_blank" href=https://pikwizard.com/photo/digital-financial-graphs-and-statistics-with-dynamic-symbols/f0d0a514d9f616290ab6ebb01d9bb95e/>PikWizard</a>
</span>
</span>
<span class="image-link">
<span
style="margin: 0 0 20px 0; display: inline-block; vertical-align: middle; width: 100%;"
>
<a
target="_blank"
href="https://pikwizard.com/photo/digital-financial-graphs-and-statistics-with-dynamic-symbols/f0d0a514d9f616290ab6ebb01d9bb95e/"
style="text-decoration: none; font-size: 10px; margin: 0;"
>
<img src="https://pikwizard.com/pw/medium/f0d0a514d9f616290ab6ebb01d9bb95e.jpg" style="margin: 0; width: 100%;" alt="" />
<p style="font-size: 12px; margin: 0;">PikWizard</p>
</a>
</span>
</span>
Free (free of charge)
Free for personal and commercial use.
Author: Creative Art
Similar Free Stock Images

Premium


Premium


Premium


Premium


Premium


Premium


Premium


Premium


Premium


Premium


Premium


Premium


Premium


Premium


Premium


Premium


Premium


Premium


Premium


Premium


Premium


Premium


Premium


Premium