- Home >
- Stock Photos >
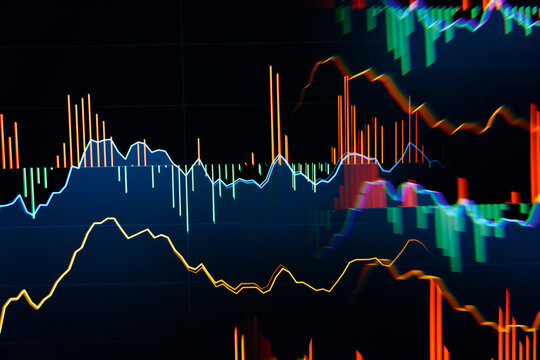
- Digital Financial Graphs and Stock Market Data Visualization
Digital Financial Graphs and Stock Market Data Visualization Image

Illustration of multiple graphs and stock trading data against a gradient background. This is ideal for presentations, reports, or articles related to financial forecasting, market analysis, and economic growth. Can be used by professionals in finance, technology, and business to represent data-driven insights and strategies.
Powered by 


2
downloads
downloads
Tags:
More
Credit Photo
If you would like to credit the Photo, here are some ways you can do so
Text Link
photo Link
<span class="text-link">
<span>
<a target="_blank" href=https://pikwizard.com/photo/digital-financial-graphs-and-stock-market-data-visualization/ac708f8e96ca436c434960d5548ea91f/>PikWizard</a>
</span>
</span>
<span class="image-link">
<span
style="margin: 0 0 20px 0; display: inline-block; vertical-align: middle; width: 100%;"
>
<a
target="_blank"
href="https://pikwizard.com/photo/digital-financial-graphs-and-stock-market-data-visualization/ac708f8e96ca436c434960d5548ea91f/"
style="text-decoration: none; font-size: 10px; margin: 0;"
>
<img src="https://pikwizard.com/pw/medium/ac708f8e96ca436c434960d5548ea91f.jpg" style="margin: 0; width: 100%;" alt="" />
<p style="font-size: 12px; margin: 0;">PikWizard</p>
</a>
</span>
</span>
Free (free of charge)
Free for personal and commercial use.
Author: Authentic Images
Similar Free Stock Images

Premium


Premium


Premium


Premium


Premium


Premium


Premium


Premium


Premium


Premium


Premium


Premium


Premium


Premium


Premium


Premium


Premium


Premium


Premium


Premium


Premium


Premium


Premium


Premium