- Home >
- Stock Photos >
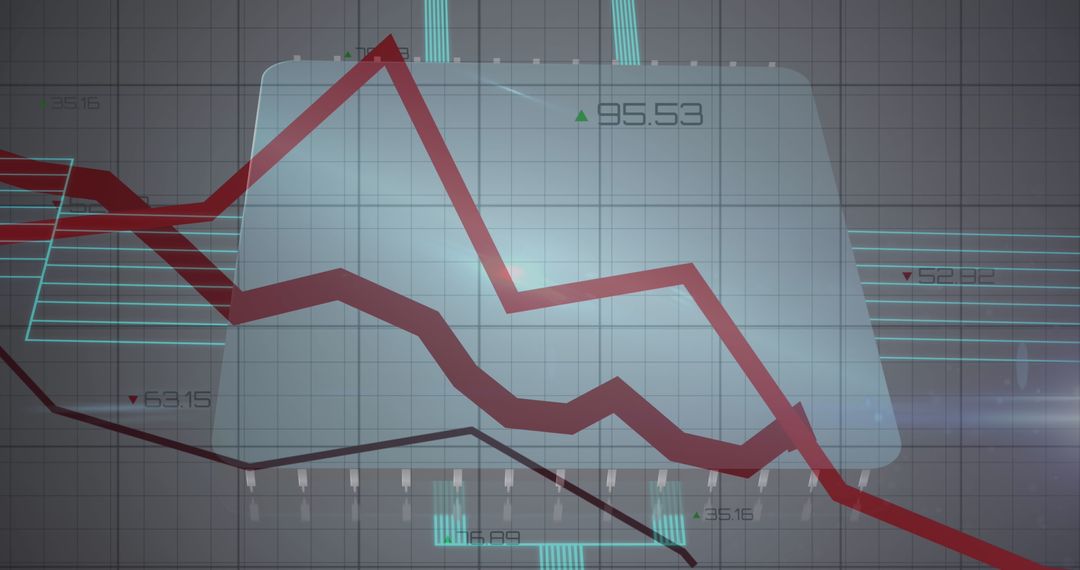
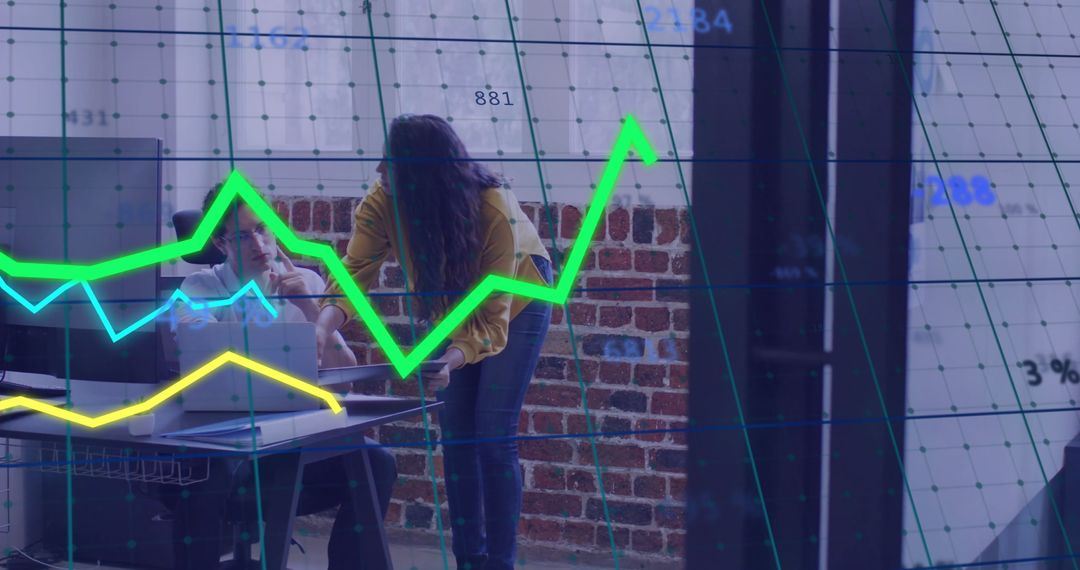
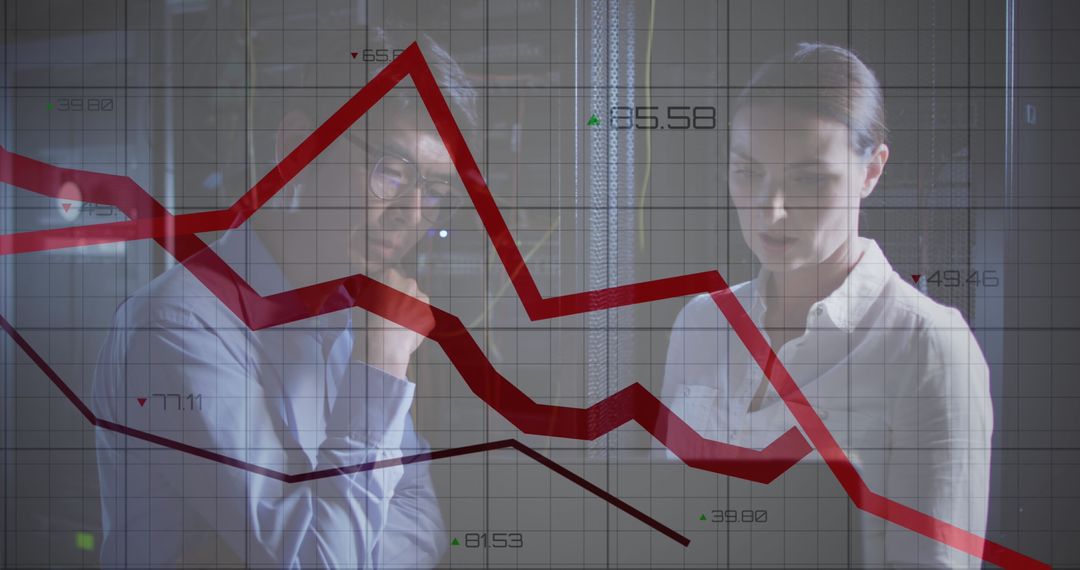
- Digital Financial Graphs Overlapping Modern Office Scene
Digital Financial Graphs Overlapping Modern Office Scene Image

Silhouette of office environment displays vibrant financial graphs, showcasing data related to business analysis and stock trends. This visual is perfect for use in presentations on economy, online financial courses, and conceptual demonstrations of digital interfaces in finance sectors.
Powered by  - Get 15% off with code: PIKWIZARD15


2
downloads
downloads
Tags:
More
Credit Photo
If you would like to credit the Photo, here are some ways you can do so
Text Link
photo Link
<span class="text-link">
<span>
<a target="_blank" href=https://pikwizard.com/photo/digital-financial-graphs-overlapping-modern-office-scene/73dc2e11d6ad6cf45baf3097ad812709/>PikWizard</a>
</span>
</span>
<span class="image-link">
<span
style="margin: 0 0 20px 0; display: inline-block; vertical-align: middle; width: 100%;"
>
<a
target="_blank"
href="https://pikwizard.com/photo/digital-financial-graphs-overlapping-modern-office-scene/73dc2e11d6ad6cf45baf3097ad812709/"
style="text-decoration: none; font-size: 10px; margin: 0;"
>
<img src="https://pikwizard.com/pw/medium/73dc2e11d6ad6cf45baf3097ad812709.jpg" style="margin: 0; width: 100%;" alt="" />
<p style="font-size: 12px; margin: 0;">PikWizard</p>
</a>
</span>
</span>
Free (free of charge)
Free for personal and commercial use.
Author: Awesome Content
Similar Free Stock Images

Premium


Premium


Premium


Premium


Premium


Premium


Premium


Premium


Premium


Premium


Premium


Premium


Premium


Premium


Premium


Premium


Premium


Premium


Premium


Premium


Premium


Premium


Premium


Premium