- Home >
- Stock Photos >
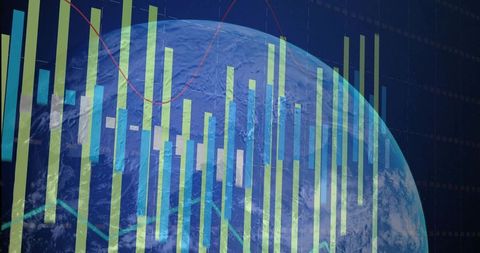
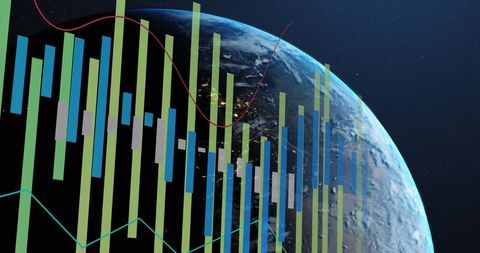
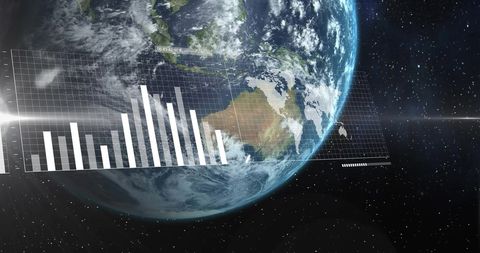
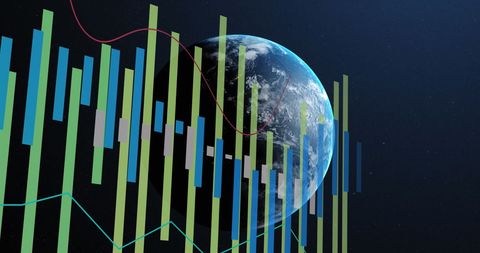
- Digital Financial Graphs Overlaying Earth's Horizon
Digital Financial Graphs Overlaying Earth's Horizon Image

Overlaid financial graphs with Earth in background illustrate global business trends and futuristic technology concepts. Useful for presentations on global finance, technology advancements or reporting economic data analytics.
Powered by 


2
downloads
downloads
Tags:
More
Credit Photo
If you would like to credit the Photo, here are some ways you can do so
Text Link
photo Link
<span class="text-link">
<span>
<a target="_blank" href=https://pikwizard.com/photo/digital-financial-graphs-overlaying-earths-horizon/e6f619fdcd1d5d1009c8b1b955aba715/>PikWizard</a>
</span>
</span>
<span class="image-link">
<span
style="margin: 0 0 20px 0; display: inline-block; vertical-align: middle; width: 100%;"
>
<a
target="_blank"
href="https://pikwizard.com/photo/digital-financial-graphs-overlaying-earths-horizon/e6f619fdcd1d5d1009c8b1b955aba715/"
style="text-decoration: none; font-size: 10px; margin: 0;"
>
<img src="https://pikwizard.com/pw/medium/e6f619fdcd1d5d1009c8b1b955aba715.jpg" style="margin: 0; width: 100%;" alt="" />
<p style="font-size: 12px; margin: 0;">PikWizard</p>
</a>
</span>
</span>
Free (free of charge)
Free for personal and commercial use.
Author: Creative Art
Similar Free Stock Images
Loading...

Premium


Premium


Premium


Premium


Premium


Premium


Premium


Premium


Premium


Premium


Premium


Premium


Premium


Premium


Premium

Premium


Premium


Premium


Premium


Premium


Premium


Premium


Premium


Premium


Premium