- Home >
- Stock Photos >
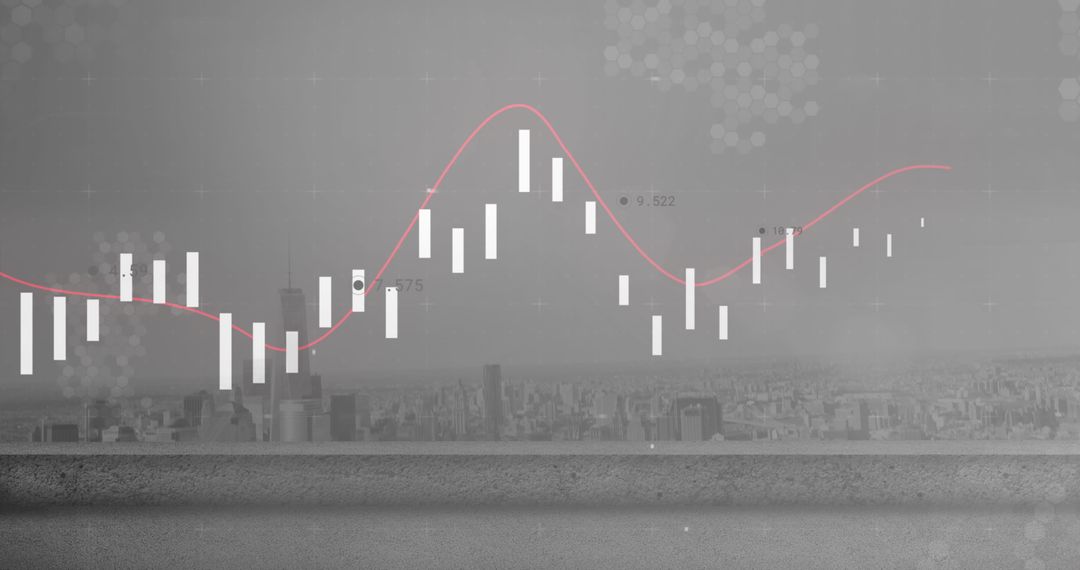
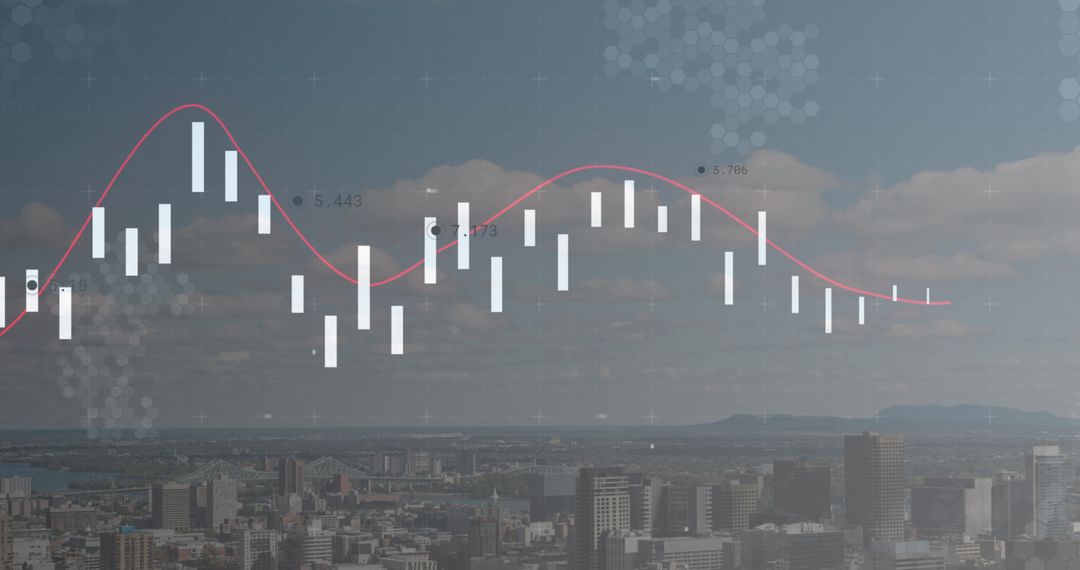
- Digital Financial Graphs Separated by Urban Architecture
Digital Financial Graphs Separated by Urban Architecture Image

Digital overlays displaying fluctuating financial graphs against a backdrop of urban architecture. Ideal for illustrating concepts of city economics, digital finance, global data analysis, and investment strategies. Useful for presentations involving urban technological advancements and digital economy trends.
Powered by 


2
downloads
downloads
Tags:
More
Credit Photo
If you would like to credit the Photo, here are some ways you can do so
Text Link
photo Link
<span class="text-link">
<span>
<a target="_blank" href=https://pikwizard.com/photo/digital-financial-graphs-separated-by-urban-architecture/b720a7c243cc51b70fa5584e3f1e9e73/>PikWizard</a>
</span>
</span>
<span class="image-link">
<span
style="margin: 0 0 20px 0; display: inline-block; vertical-align: middle; width: 100%;"
>
<a
target="_blank"
href="https://pikwizard.com/photo/digital-financial-graphs-separated-by-urban-architecture/b720a7c243cc51b70fa5584e3f1e9e73/"
style="text-decoration: none; font-size: 10px; margin: 0;"
>
<img src="https://pikwizard.com/pw/medium/b720a7c243cc51b70fa5584e3f1e9e73.jpg" style="margin: 0; width: 100%;" alt="" />
<p style="font-size: 12px; margin: 0;">PikWizard</p>
</a>
</span>
</span>
Free (free of charge)
Free for personal and commercial use.
Author: Awesome Content
Similar Free Stock Images

Premium


Premium


Premium


Premium


Premium


Premium


Premium


Premium


Premium


Premium


Premium


Premium


Premium


Premium


Premium


Premium


Premium


Premium


Premium


Premium


Premium


Premium


Premium


Premium