- Home >
- Stock Photos >
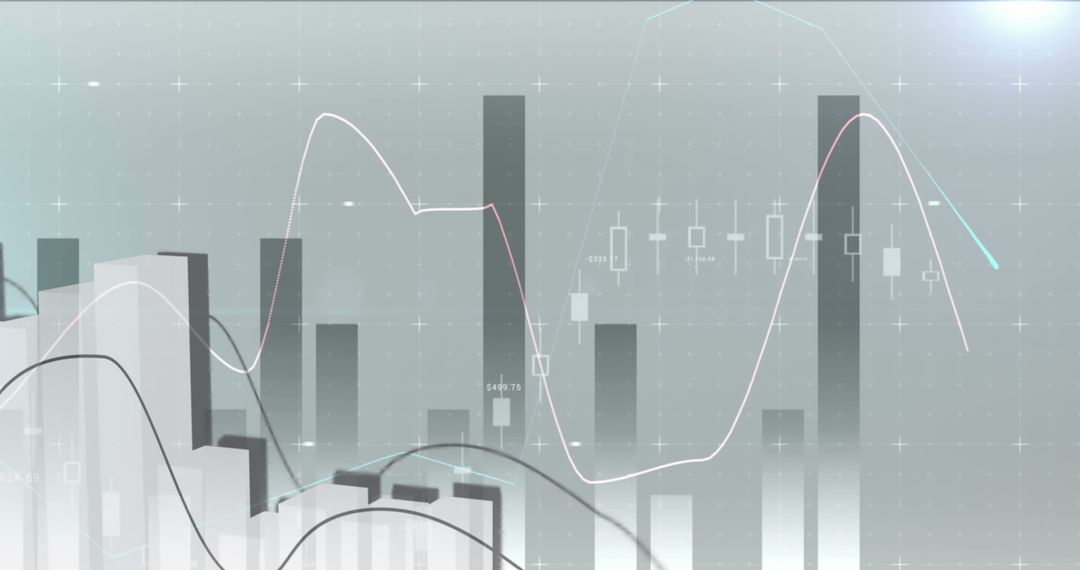
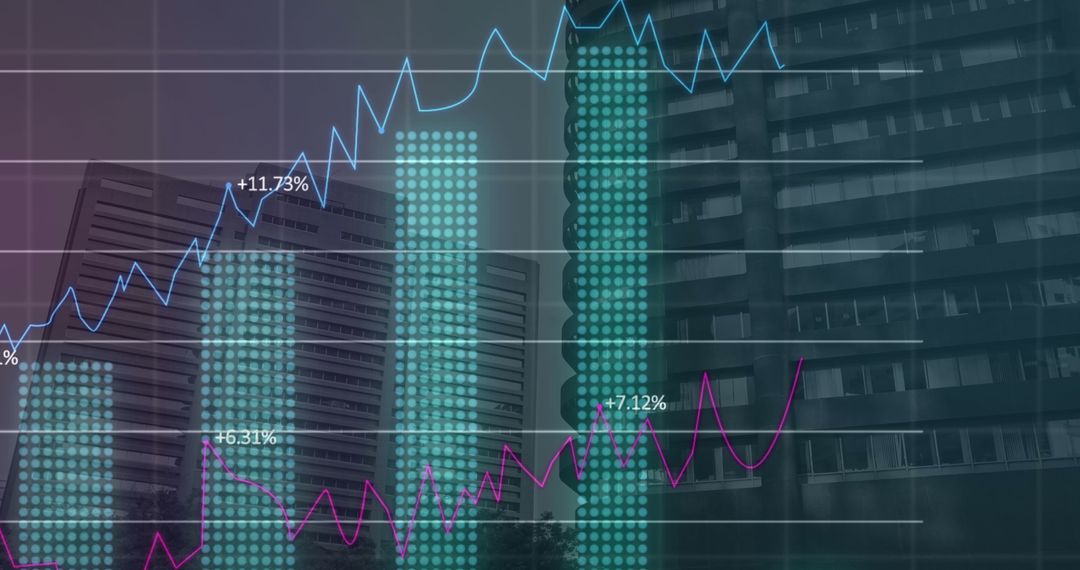
- Digital Financial Growth Analysis with Bars and Line Charts
Digital Financial Growth Analysis with Bars and Line Charts Image

This image featuring a colorful dashboard with bar and line charts conveys digital financial analysis and market trends. Useful for illustrating business growth, data interpretation articles, financial reports, or presentations covering economic strategies and decision-making.
Powered by  - Get 15% off with code: PIKWIZARD15


0
downloads
downloads
Tags:
More
Credit Photo
If you would like to credit the Photo, here are some ways you can do so
Text Link
photo Link
<span class="text-link">
<span>
<a target="_blank" href=https://pikwizard.com/photo/digital-financial-growth-analysis-with-bars-and-line-charts/2b8418464973e0324f37129e6787f9e8/>PikWizard</a>
</span>
</span>
<span class="image-link">
<span
style="margin: 0 0 20px 0; display: inline-block; vertical-align: middle; width: 100%;"
>
<a
target="_blank"
href="https://pikwizard.com/photo/digital-financial-growth-analysis-with-bars-and-line-charts/2b8418464973e0324f37129e6787f9e8/"
style="text-decoration: none; font-size: 10px; margin: 0;"
>
<img src="https://pikwizard.com/pw/medium/2b8418464973e0324f37129e6787f9e8.jpg" style="margin: 0; width: 100%;" alt="" />
<p style="font-size: 12px; margin: 0;">PikWizard</p>
</a>
</span>
</span>
Free (free of charge)
Free for personal and commercial use.
Author: Creative Art
Similar Free Stock Images

Premium


Premium


Premium


Premium


Premium


Premium


Premium


Premium


Premium


Premium


Premium


Premium


Premium


Premium


Premium


Premium


Premium


Premium


Premium


Premium


Premium


Premium


Premium


Premium