1. Home > 
  2. Stock Photos > 
  3. Digital Financial Growth Chart for Analytics

Digital Financial Growth Chart for Analytics Image

Digital Financial Growth Chart for Analytics

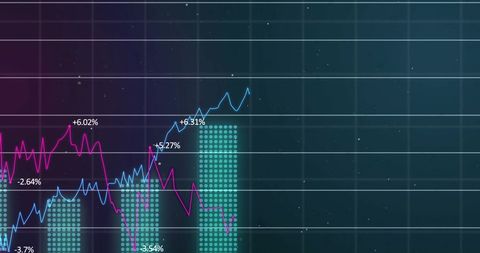
Financial data graphs curves upwards over dark grid background. Perfect for illustrating concepts of business growth, data analytics, and digital finance transformation. Suitable for use in business presentations, financial service advertisements, webinars, and investment reports.

Powered by Adobe logo
Hands analyzing financial data with magnifying glass showing upward trend from 2022 to 2026 on glowing chart in futuristic business concept. - Powered by AdobeClose up shot of a magnifying glass over blue toned financial data sheets with graphs, tables, and numbers for business analysis and research. - Powered by AdobeDynamic financial growth chart illuminated with vibrant neon lines and data points, symbolizing innovation and successful business strategy - Powered by AdobeA professional business person holds a tablet displaying a financial growth chart, showcasing data analytics against a night city skyline and star-filled sky. Scalp - Powered by AdobeBusinessman analyzing financial growth with digital data and charts - Powered by Adobe

Credit Photo

If you would like to credit the Photo, here are some ways you can do so

Free (free of charge)

Free for personal and commercial use.

Author: Creative Art

Similar Free Stock Images

Digital DNA Strand Overlaid with Scientific Data Patterns
Premium
Dynamic digital financial graph with glowing purple and blue trend lines on dark background displaying market analytics data for investment technology
Digital Data Visualization with Trend Lines and Percentage Changes
Premium
The vibrant growth chart showcasing dynamic financial trends in a modern office environment.
Digital Finance: Modern Stock Market Analysis Display
Dynamic Stock Market Graphs and Financial Data
Premium
Man analyzing growth chart with pen and smartphone charting financial success
Data Analytics Graphs on Digital Interface Background
Dynamic Financial Graph Over Red Background
Dynamic Stock Market Graph Displaying Surging Growth
Innovative Data Analysis with Dynamic Line Graph and Digital Elements
Premium
Business meeting showcases agile brainstorming with data analysis charts on tablets. Financial growth prediction strategy through predictive analytics and data-driven insights for strategic business
Rising Graph Line on Digital Green Grid Background
Statistical Data Processing with Graph Overlay on Buildings
Premium
abstract financial growth interface with glowing upward curve and human interaction businessman touching upward growth chart representing financial success and business performance
City Skyline with Overlay of Financial Market Trends
Abstract Digital Charts with Social Media Metrics Rising
Digital Cardiograph on Black Background in Colorful Display
Line Graphs on Digital Background Show Financial Data Trends
Premium
Data analytics and big data strategy for real-time analytics, predictive data modeling, business intelligence analytics, and data-driven decision-making in modern digital businesses. Thunk
Neon Round Scanner with Statistical Data Display
Rising Stock Market Graph on Blue Financial Background
Financial Data Analysis and Digital Interface Concept
Digital Financial Data Overlaying City Skyline at Dusk
Financial Graph and Waves Representing Market Trends and Data
Glowing Blue Cardiograph on Black Background Interface
Digital Interface Showing Global Business Data Analytics
Digital Interface with Global Financial Graphs Background
Futuristic Digital Graph Showing Data Trends on Analytic Interface
Digital Financial Graph Over Violet Background in Abstract Style
Graph Lines Portraying Financial Data Trends
Dynamic Financial Data Waves in Digital Cyber World
Dynamic Financial Growth Digital Chart Display
Dynamic Stock Market Chart with Fluctuating Trends and Data Points
Futuristic Financial Chart with Declining Trend
Financial Data Analysis Vibrant Graphs on Blue Background
Dynamic Financial Data on Digital Screen
Digital Financial Data Graph Showcasing Market Trends
Premium
Woman holds phone showing upward growth chart
Premium
Financial analysts adjusting holographic growth and risk charts inside a glass sky office
Futuristic Global Finance Chart with Rotating Globe Animation
Financial Data Overlay on Cityscape Visualizing Market Trends
Digital Financial Data and AI Illustration Networking Globally
Digital Data Processing with Graph and Grid Technology Interface
Premium
Businessman using financial app showing market growth using digital interface on phone
Financial Data Analysis with Futuristic Technology Interface
Fluctuating Digital Stock Market Data Chart
Dynamic Green Line Graph Depicting Financial Data
Dynamic Stock Market Graphs Over Digital Interface
NFT Financial Data Visualization with Digital Graph Overlay
Dynamic Financial Data Visualizations on Grid Interface
Data Trends and Analysis on 3D Digital Grid
Rising Digital Graph and Data Visualizations on Black Background
Dynamic Financial Graphs Overlaying Urban Skyline
Dynamic Financial Charts and Graphs Indicating Market Trends
Falling Line Graph on Navy Background Illustrating Economic Decline
Financial Data Flow against Urban Skyline Backdrop
Premium
Global financial trading chart with glowing blue bars and world map on digital interface background illustrating business data and economy concept. Ai generative
Digital Sound Wave with Frequency Bars on Dark Blue Background
Dynamic Financial Data Overlaid on Grid Background
Dynamic Stagflation Concept Displaying Economic Burdens
Abstract Representation of Financial Data Processing
Premium
A businessman in a suit is drawing a growth chart with a pen symbolizing success and financial progress
Futuristic Digital Representation of DNA Strand
Dynamic Financial Data Visualization on Digital Grid Background
Premium
Business growth chart with 2026 target and financial data
Dynamic Financial Graph in Virtual Red Grid Background
Premium
Business person works with tablet displaying growth chart data. Rocket soars above columns showcasing success. Financial analysis insights, data driven approach presented in modern tech workspace.
Interactive Social Media Metrics Overlaid on Business Data Graph
Digital Data Processing with Chart in Futuristic Interface
Rising Financial Data Graph on Digital Grid Background
Global Data Analytics Over World Map with Numeric Statistics
Premium
Green arrow pointing upward on financial graph. Business growth chart with rising trend line. Digital stock market data visualization for investment analysis
Cityscape with Digital Stock Market Graphs and Statistics
Data Recovery Progress Display on Digital Interface
Futuristic Digital Data Analytics Interface Display
Data Analytics and Financial Growth Indicators
Financial Data Graph Rendering Global Market Trends
Dynamic Data Graphs on Digital Interface Background
Premium
future financial growth concept, abstract glowing data chart rising upward, technology driven finance, innovation and success
Dynamic Financial Data Displays Stock Market Trends
Abstract Financial Graph with Rising Waves on Red Gradient
Global Networking Concept with 6G Technology Display
Digital Finance Chart Overlaying Globe Background
Premium
Business people collaborating in an office, analyzing financial charts and graphs with pens in hand. Utilizing calculators, tablets, and notebooks to strategize and plan for growth
Premium
Businessman interacting with digital forex and stock market chart interface showing buy and sell decisions with futuristic holographic data overlay.
Premium
Working on business analytics, laptop and monitor displaying data in office
Premium
Financial growth chart with upward arrow and glowing particles symbolizing success and progress.
Economic and Political Factors Influence Investment Trends
Slumpflation Concept on Armenian Flag Background
Digital Graph Displaying Dynamic Data Analysis
Line Graph Illustrating Data Trend on Green Digital Background
Premium
Holographic business growth chart with digital data wave and futuristic interface for financial success analysis
Digital Graphs and Data Visualization on Green Background
Dynamic Business Data and Cityscape Visualization
Digitized Medical Data Overlay with Cardio Graph and Medicine
Colorful Digital ECG Heartbeat Graphs on Black Background
Digital Financial Data with Graph and Grid Patterns
Financial Graphs Overlaying Shopping Bag Representation Economy
Digital Financial Data Analytics and Trend Graphs
Dynamic Financial Graphs Overlaying Modern Cityscape
Digital Financial Data Overlay on Urban Street Scene
Dynamic Financial Data Chart Showing Trend Analysis
Abstract Financial Data Chart with Positive Trends and Percentages
Financial Graph Displayed Over City Skyline at Sunset
Abstract Digital Data Graph and Diagrams on Gray Background
Premium
Data Analysis and Reporting. Business professional analyzing financial charts on laptop.
Stagflation Concept with Digital Financial Graphs
Optimized Statistical Data Overlain on Corporate Architecture
Stagflation Concept Overlaid on Palestinian Flag Background
Rising Financial Graph on Dark Grid Background
Premium
A businessman analyzes financial growth using a smartphone and laptop, with a rising bar chart and data overlay, symbolizing digital finance, investment success, and business analytics.
Premium
business graph with arrow,business graph, graph with arrow, growth chart, upward trend, business growth, analytics, statistics, financial chart, success, performance, progress, data visualization,
Financial Stock Market Data Visualization with Declining Trends
Financial Graph Analysis on Green Grid Background
Abstract Data Visualization with Dynamic Charts and Graphs
European Market Data Overlay with EU Flag and Financial Graphs
Futuristic Graph with Digital Globe Symbolizing Global Technology Connections
Colorful Data Visualization on Dark Background
Analyzing Stock Market Trends with Dynamic Graphs and Data
Abstract Digital Finance Chart Showing Fluctuating Graph Lines
Premium
Laptop displaying financial data and charts on screen, representing business analytics and investment strategies, isolated on transparent background
Premium
Business growth chart with icons in dark blue digital lighting for financial success.
Digital Stock Market Graph Red Trendline on Green Background
Financial Growth Stock Nikkei in Urban City Skyline
Explore More Free Stock Images