
- Home >
- Stock Photos >
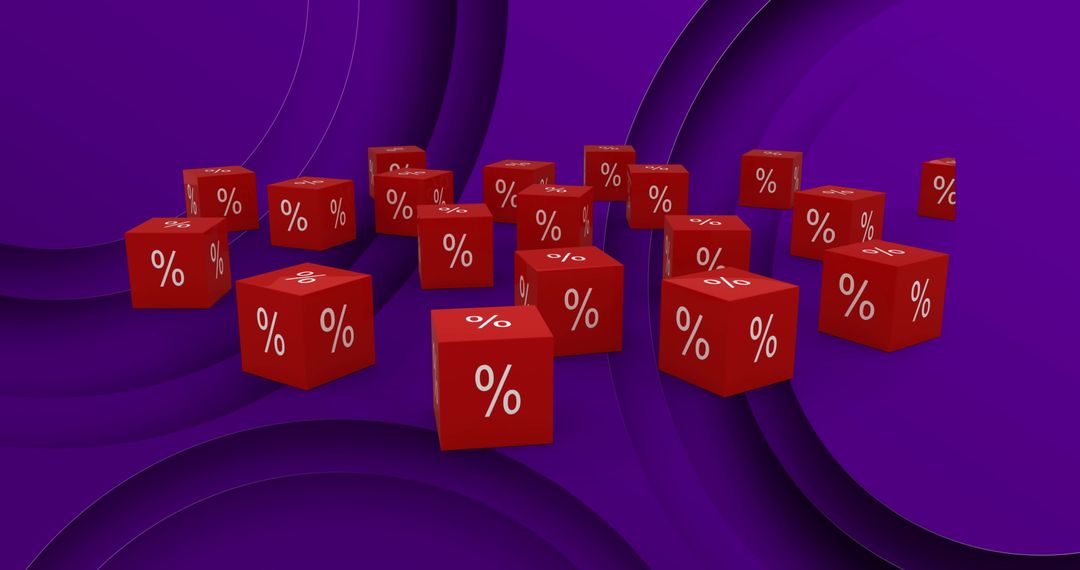
- Digital Financial Growth Visualization with Percentage and Data Graphs
Digital Financial Growth Visualization with Percentage and Data Graphs Image
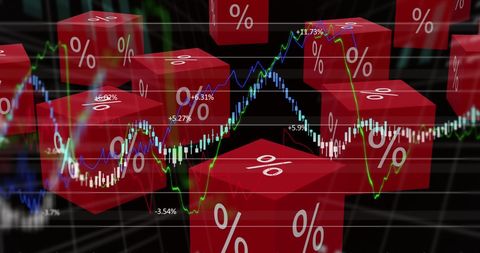
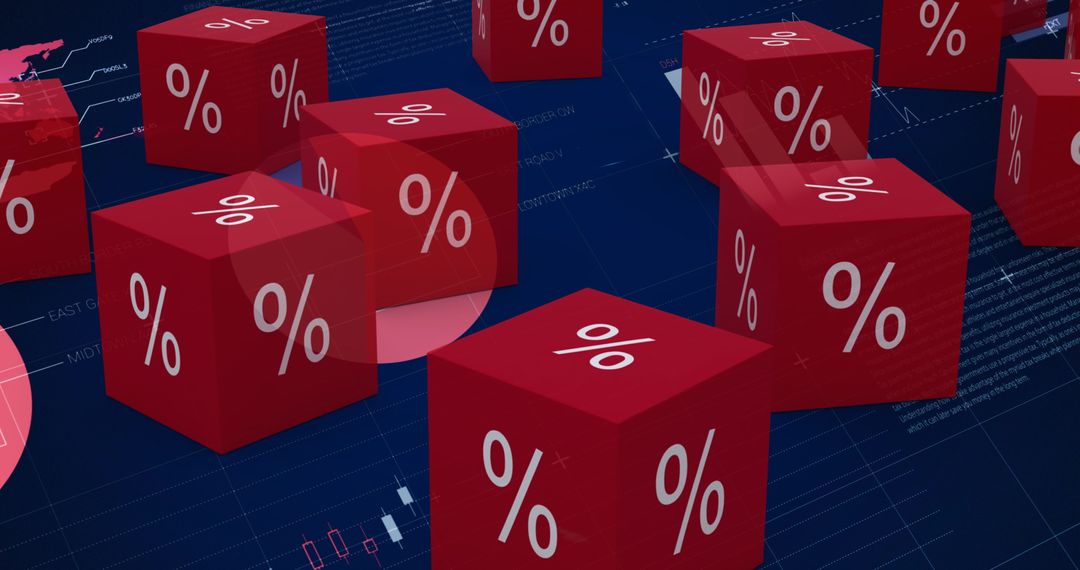
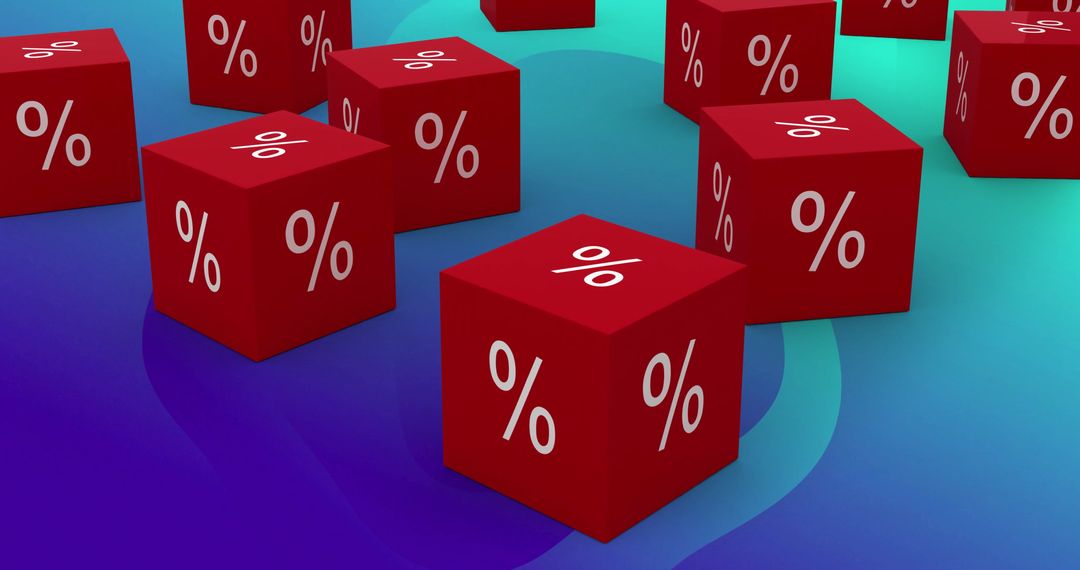
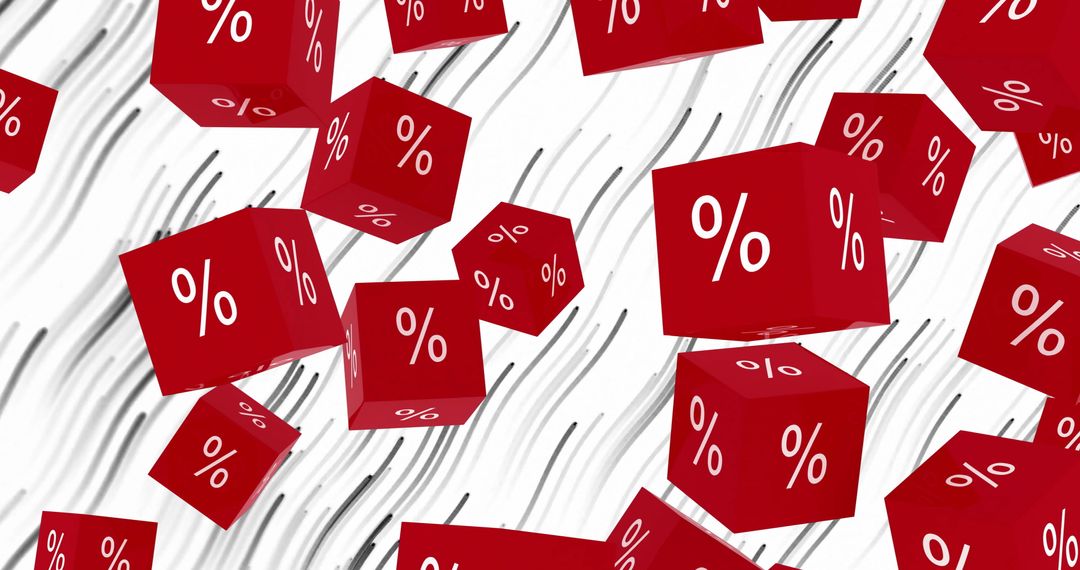
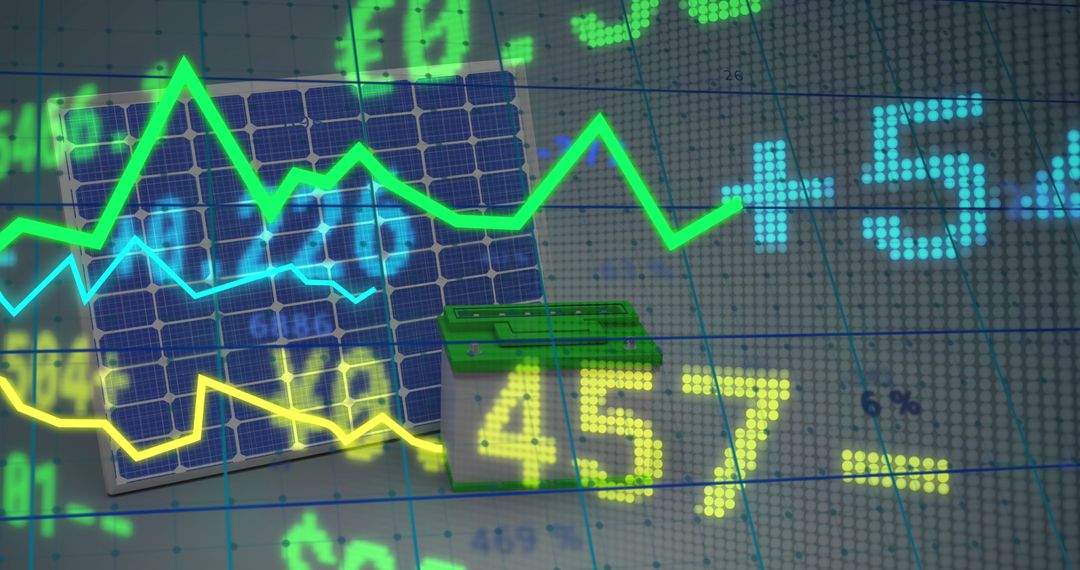
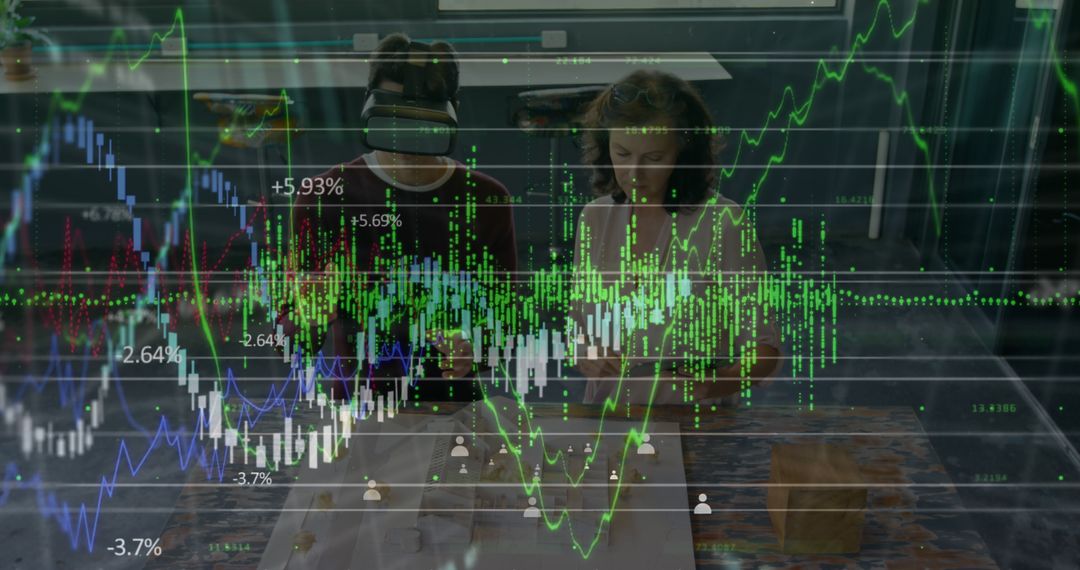
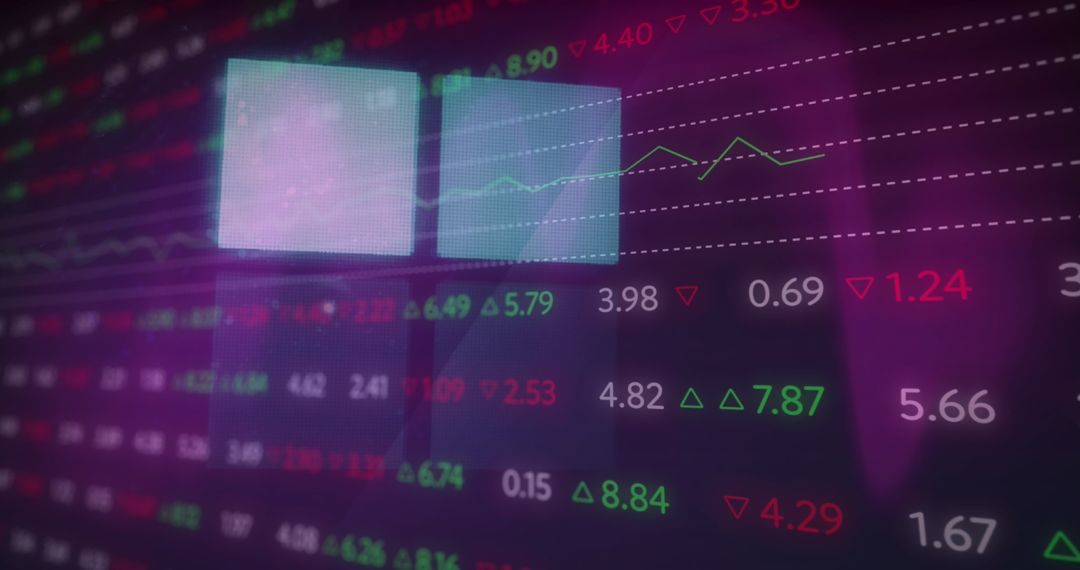
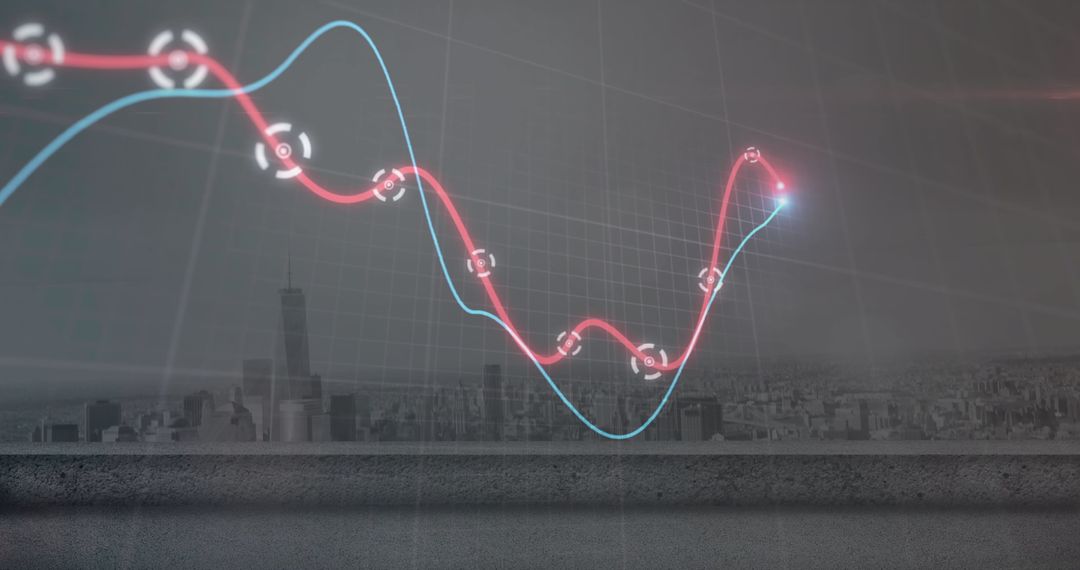
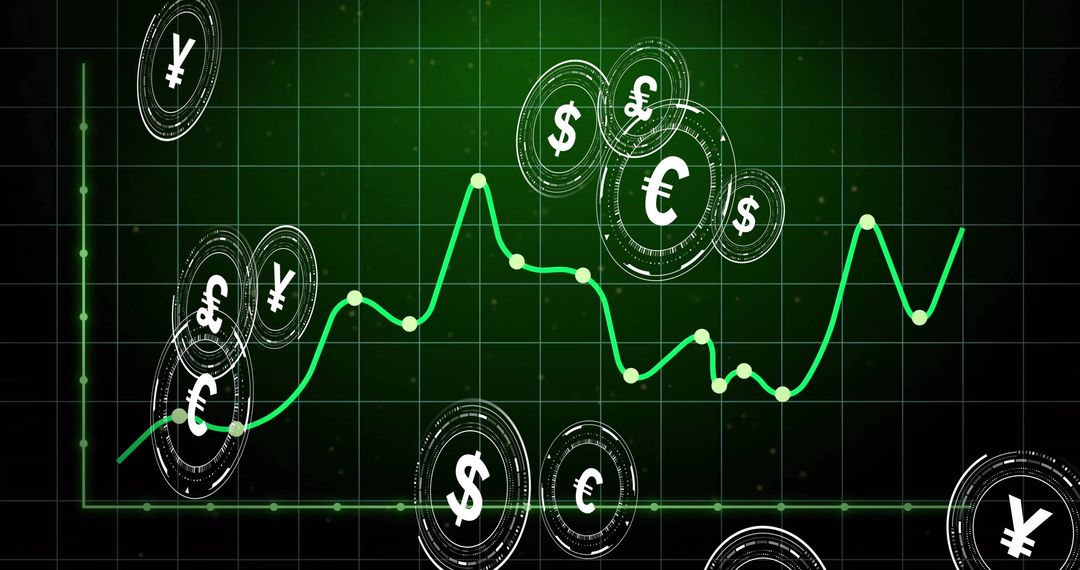
Digital visualization depicting financial growth trends using red cubes with percentage signs and overlay graphs. Ideal for illustrating concepts in global finance, data analysis presentations, economic reports, and digital financial tools.
Powered by 


0
downloads
downloads
Tags:
More
Credit Photo
If you would like to credit the Photo, here are some ways you can do so
Text Link
photo Link
<span class="text-link">
<span>
<a target="_blank" href=https://pikwizard.com/photo/digital-financial-growth-visualization-with-percentage-and-data-graphs/4984d04c21320348cf31f305e1bdc6c9/>PikWizard</a>
</span>
</span>
<span class="image-link">
<span
style="margin: 0 0 20px 0; display: inline-block; vertical-align: middle; width: 100%;"
>
<a
target="_blank"
href="https://pikwizard.com/photo/digital-financial-growth-visualization-with-percentage-and-data-graphs/4984d04c21320348cf31f305e1bdc6c9/"
style="text-decoration: none; font-size: 10px; margin: 0;"
>
<img src="https://pikwizard.com/pw/medium/4984d04c21320348cf31f305e1bdc6c9.jpg" style="margin: 0; width: 100%;" alt="" />
<p style="font-size: 12px; margin: 0;">PikWizard</p>
</a>
</span>
</span>
Free (free of charge)
Free for personal and commercial use.
Author: Authentic Images
Similar Free Stock Images

Premium


Premium


Premium


Premium


Premium


Premium


Premium


Premium


Premium


Premium


Premium


Premium


Premium


Premium


Premium


Premium


Premium


Premium


Premium


Premium


Premium


Premium


Premium


Premium

