- Home >
- Stock Photos >
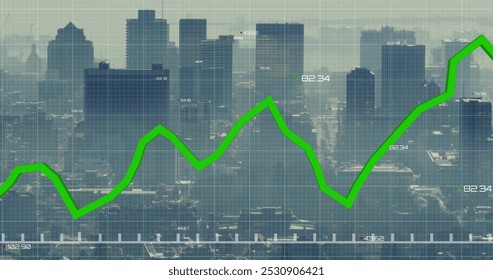
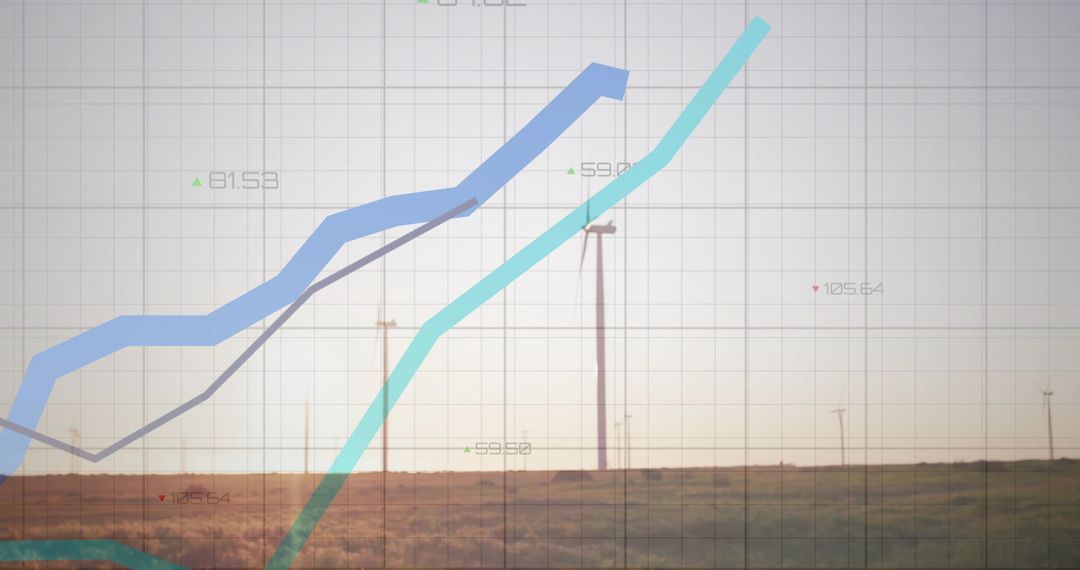
- Digital Financial Growth with Green Line Graph and Statistics
Digital Financial Growth with Green Line Graph and Statistics Image

Green line ascending on a digital grid indicates financial growth or positive trends in business analytics. This illustration is ideal for presentations, reports, or articles relating to business finance, stock market analysis, or economic forecasts. It is useful for highlighting data-driven decision making and strategy development in a corporate context.
Powered by  - Get 15% off with code: PIKWIZARD15


0
downloads
downloads
Tags:
More
Credit Photo
If you would like to credit the Photo, here are some ways you can do so
Text Link
photo Link
<span class="text-link">
<span>
<a target="_blank" href=https://pikwizard.com/photo/digital-financial-growth-with-green-line-graph-and-statistics/30de455df91c9b6a92e6db66289a22f8/>PikWizard</a>
</span>
</span>
<span class="image-link">
<span
style="margin: 0 0 20px 0; display: inline-block; vertical-align: middle; width: 100%;"
>
<a
target="_blank"
href="https://pikwizard.com/photo/digital-financial-growth-with-green-line-graph-and-statistics/30de455df91c9b6a92e6db66289a22f8/"
style="text-decoration: none; font-size: 10px; margin: 0;"
>
<img src="https://pikwizard.com/pw/medium/30de455df91c9b6a92e6db66289a22f8.jpg" style="margin: 0; width: 100%;" alt="" />
<p style="font-size: 12px; margin: 0;">PikWizard</p>
</a>
</span>
</span>
Free (free of charge)
Free for personal and commercial use.
Author: Creative Art
Similar Free Stock Images

Premium


Premium


Premium


Premium


Premium


Premium


Premium


Premium


Premium


Premium


Premium


Premium


Premium


Premium


Premium


Premium


Premium


Premium


Premium


Premium