
- Home >
- Stock Photos >
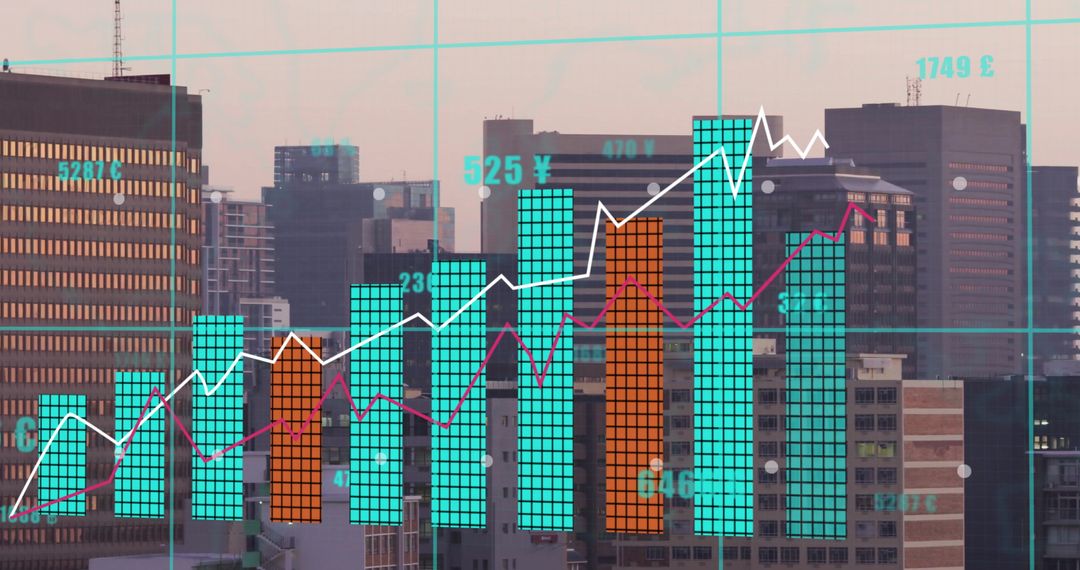
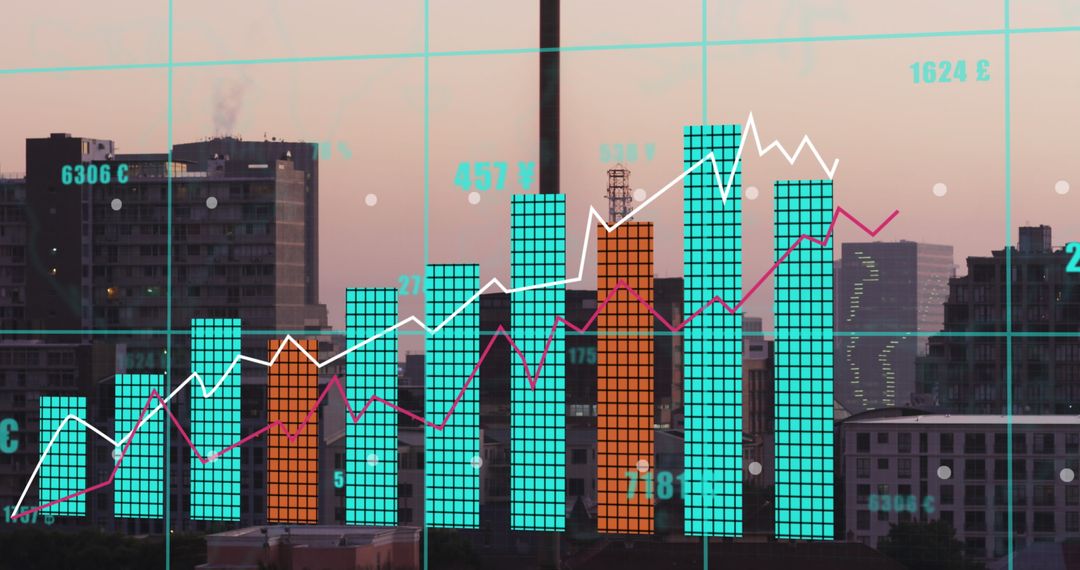
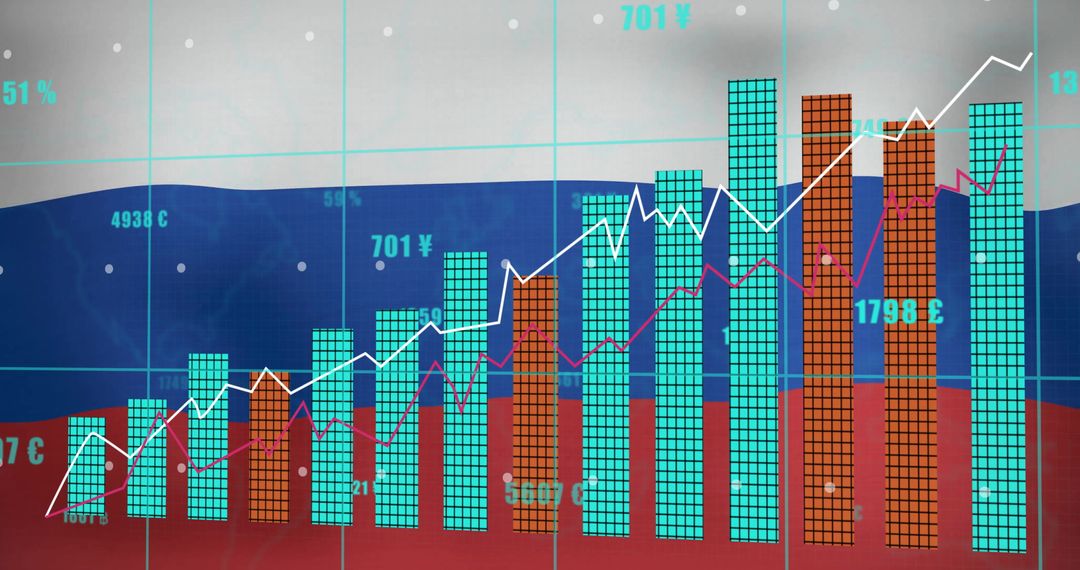
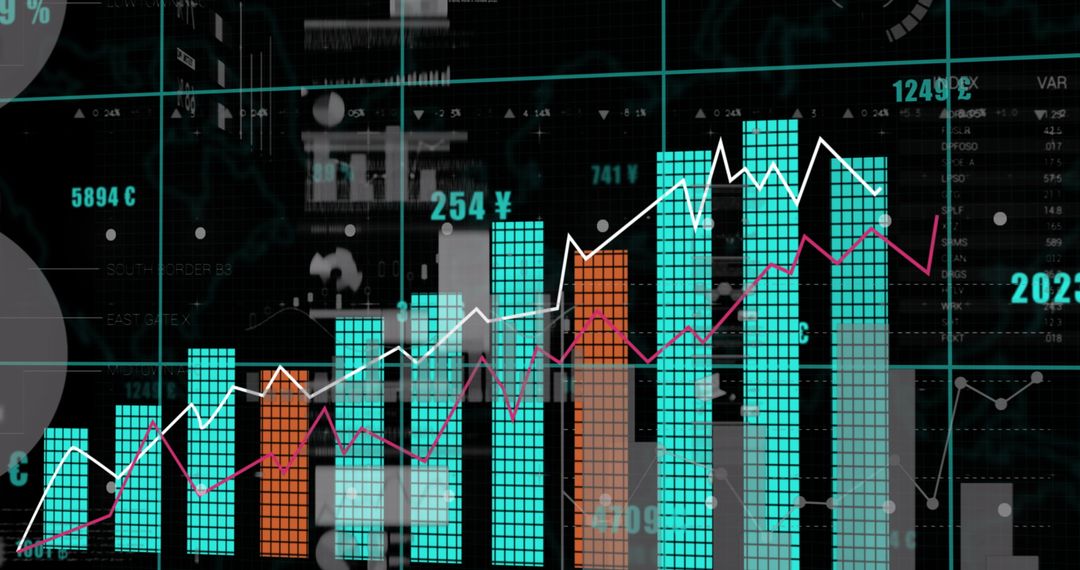
- Digital Financial Growth with Rising Bar and Line Graphs
Digital Financial Growth with Rising Bar and Line Graphs Image

Depicting rising bar and line graphs superimposed on an urban office backdrop, this visual highlights global financial trends and data analytics. The blend of technology and finance suggests volumetric intersections of economic sectors. Ideal for illustrating concepts in economics, modern finance interfaces, or tech-focused financial reports.
Powered by  - Get 15% off with code: PIKWIZARD15


2
downloads
downloads
Tags:
More
Credit Photo
If you would like to credit the Photo, here are some ways you can do so
Text Link
photo Link
<span class="text-link">
<span>
<a target="_blank" href=https://pikwizard.com/photo/digital-financial-growth-with-rising-bar-and-line-graphs/abdb95cb676220e8046e61b1309a8039/>PikWizard</a>
</span>
</span>
<span class="image-link">
<span
style="margin: 0 0 20px 0; display: inline-block; vertical-align: middle; width: 100%;"
>
<a
target="_blank"
href="https://pikwizard.com/photo/digital-financial-growth-with-rising-bar-and-line-graphs/abdb95cb676220e8046e61b1309a8039/"
style="text-decoration: none; font-size: 10px; margin: 0;"
>
<img src="https://pikwizard.com/pw/medium/abdb95cb676220e8046e61b1309a8039.jpg" style="margin: 0; width: 100%;" alt="" />
<p style="font-size: 12px; margin: 0;">PikWizard</p>
</a>
</span>
</span>
Free (free of charge)
Free for personal and commercial use.
Author: Creative Art
Similar Free Stock Images

Premium


Premium


Premium


Premium


Premium


Premium


Premium


Premium


Premium


Premium


Premium


Premium


Premium


Premium


Premium


Premium


Premium


Premium


Premium


Premium


Premium


Premium


Premium


Premium
