
- Home >
- Stock Photos >
- Digital Financial Interface with Real-Time Data Visualization
Digital Financial Interface with Real-Time Data Visualization Image
AI
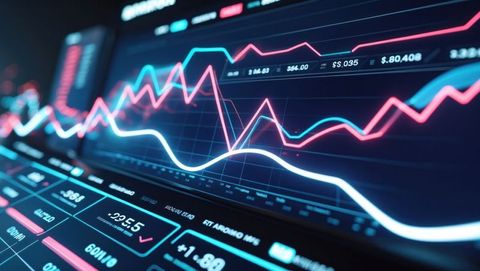
AI Generated Image. An advanced display of financial data visualization glowing with neon line charts highlighting dynamic market analysis. Suitable for illustrating concepts related to digital trading, financial technology, and real-time analytics—ideal for finance presentations, blog articles about trading strategies, or educational posts on data interpretation techniques.
Powered by  - Get 15% off with code: PIKWIZARD15


downloads
Tags:
More
Credit Photo
If you would like to credit the Photo, here are some ways you can do so
Text Link
photo Link
<span class="text-link">
<span>
<a target="_blank" href=https://pikwizard.com/photo/digital-financial-interface-with-real-time-data-visualization/63c37f034dbea9b02cfae4226199ff6f/>PikWizard</a>
</span>
</span>
<span class="image-link">
<span
style="margin: 0 0 20px 0; display: inline-block; vertical-align: middle; width: 100%;"
>
<a
target="_blank"
href="https://pikwizard.com/photo/digital-financial-interface-with-real-time-data-visualization/63c37f034dbea9b02cfae4226199ff6f/"
style="text-decoration: none; font-size: 10px; margin: 0;"
>
<img src="https://pikwizard.com/pw/medium/63c37f034dbea9b02cfae4226199ff6f.jpg" style="margin: 0; width: 100%;" alt="" />
<p style="font-size: 12px; margin: 0;">PikWizard</p>
</a>
</span>
</span>
Free (free of charge)
Free for personal and commercial use.
Author: AI Creator