
- Home >
- Stock Photos >
- Digital Financial Market Analytics Chart and Global Visualization
Digital Financial Market Analytics Chart and Global Visualization Image
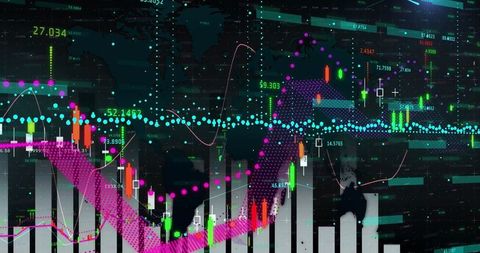
This dynamic visualization of financial market analytics is perfect for illustrating complex trading platforms. Incorporating candlestick charts, trend lines, and a global map adds a sophisticated layer, ideal for articles on global investment, financial technology, and economic analysis. Use it to enhance presentations on market trends, investment strategies, or fintech developments.
Powered by 


downloads
Tags:
More
Credit Photo
If you would like to credit the Photo, here are some ways you can do so
Text Link
photo Link
<span class="text-link">
<span>
<a target="_blank" href=https://pikwizard.com/photo/digital-financial-market-analytics-chart-and-global-visualization/d6fa7e4a012b5a2cff95b640377eeaee/>PikWizard</a>
</span>
</span>
<span class="image-link">
<span
style="margin: 0 0 20px 0; display: inline-block; vertical-align: middle; width: 100%;"
>
<a
target="_blank"
href="https://pikwizard.com/photo/digital-financial-market-analytics-chart-and-global-visualization/d6fa7e4a012b5a2cff95b640377eeaee/"
style="text-decoration: none; font-size: 10px; margin: 0;"
>
<img src="https://pikwizard.com/pw/medium/d6fa7e4a012b5a2cff95b640377eeaee.jpg" style="margin: 0; width: 100%;" alt="" />
<p style="font-size: 12px; margin: 0;">PikWizard</p>
</a>
</span>
</span>
Free (free of charge)
Free for personal and commercial use.
Author: Awesome Content