1. Home > 
  2. Stock Photos > 
  3. Digital Financial Market Data Analysis

Digital Financial Market Data Analysis Image

Digital Financial Market Data Analysis

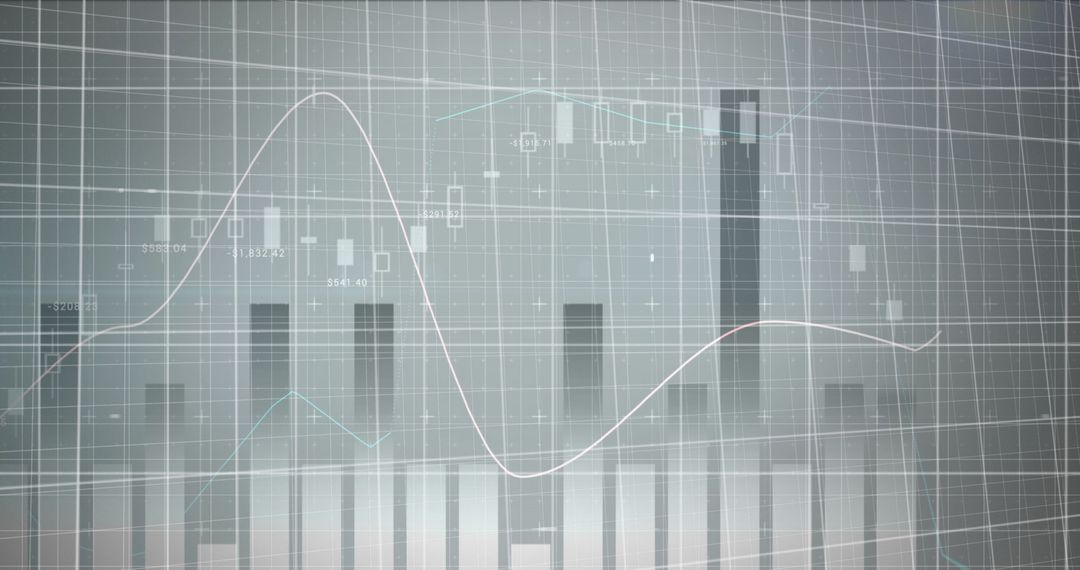
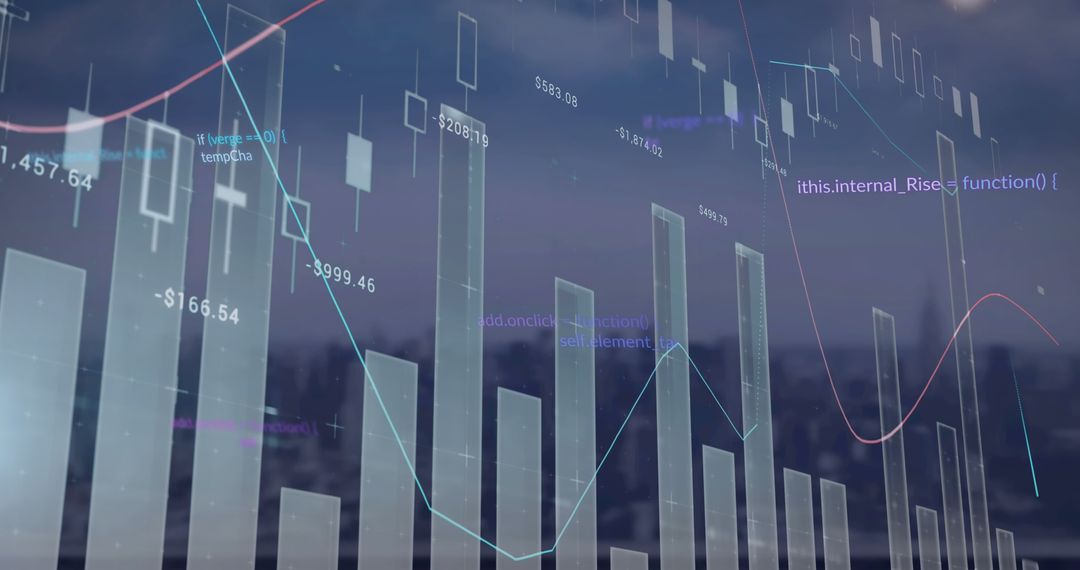
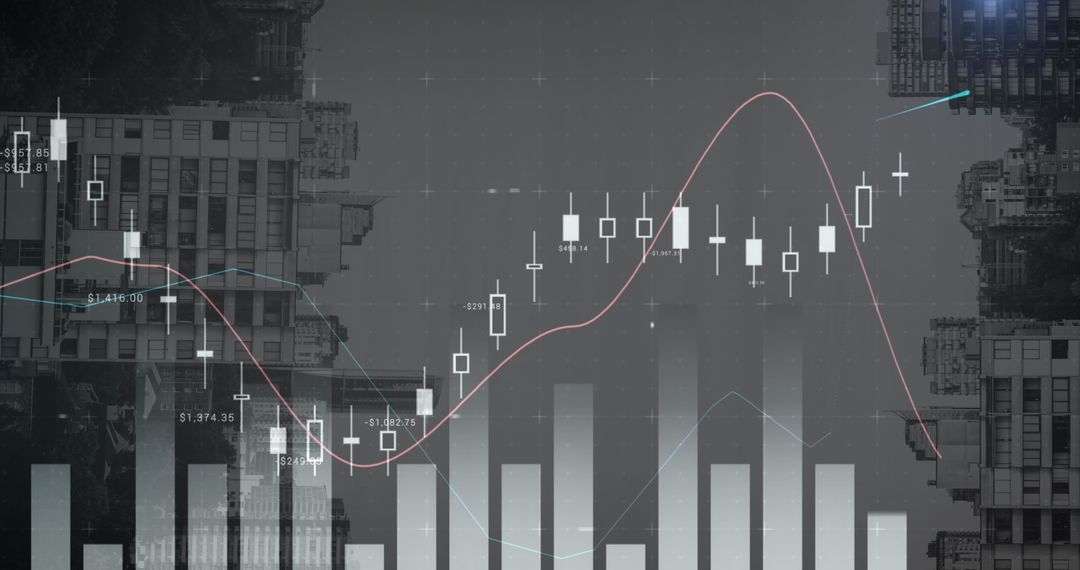
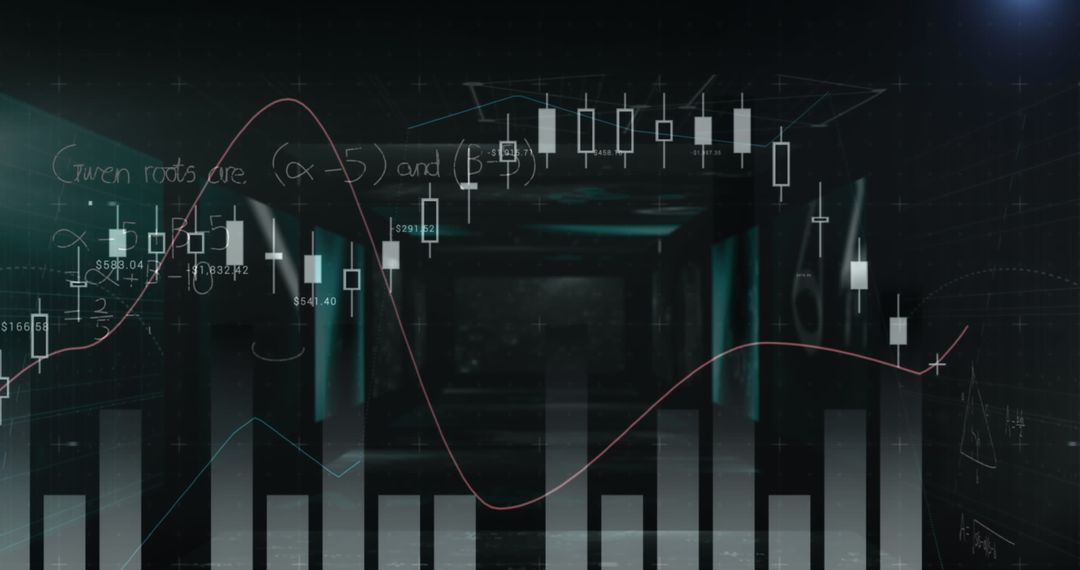
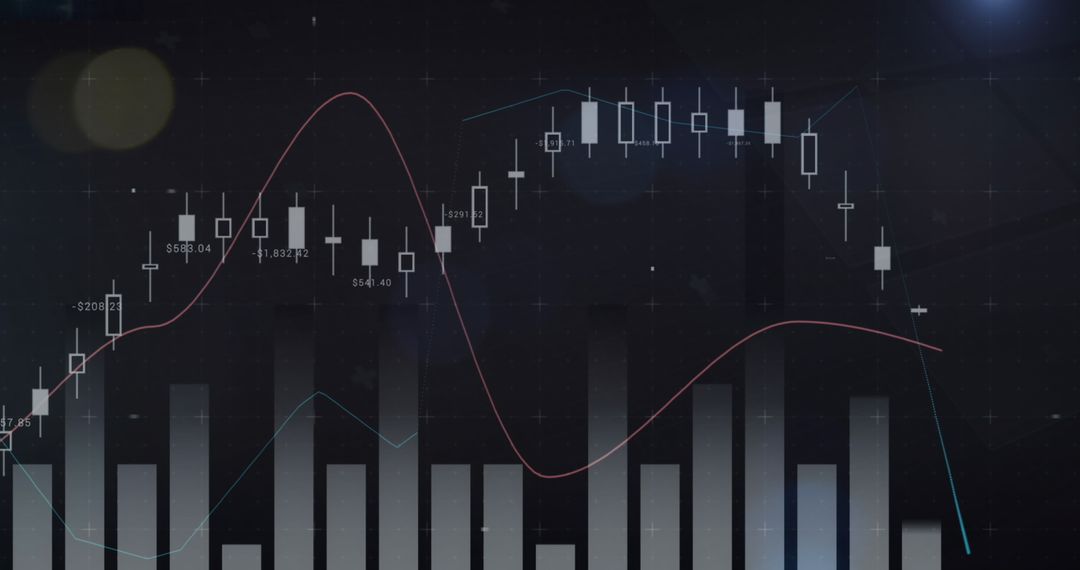
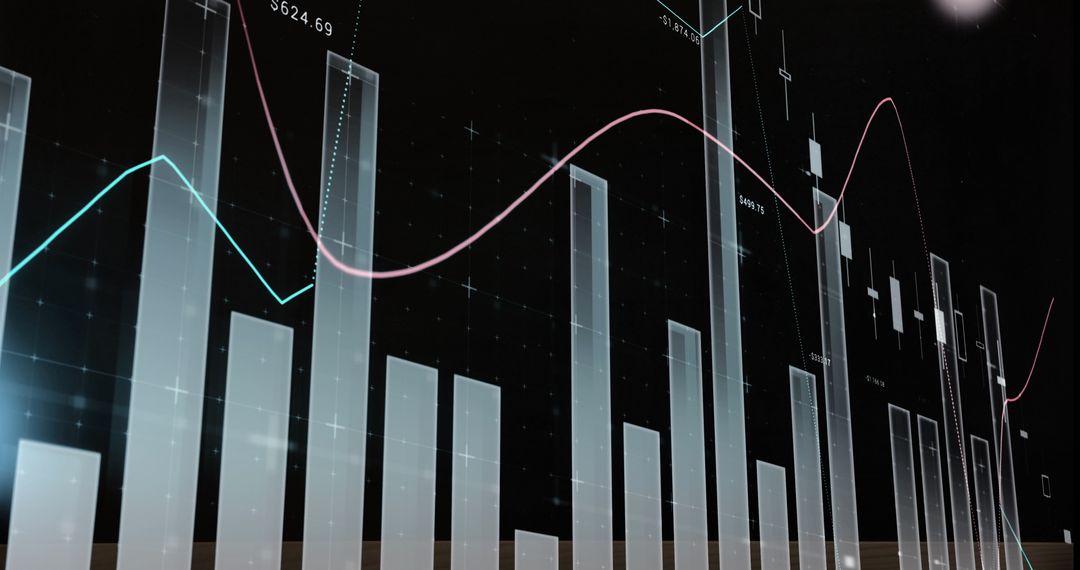
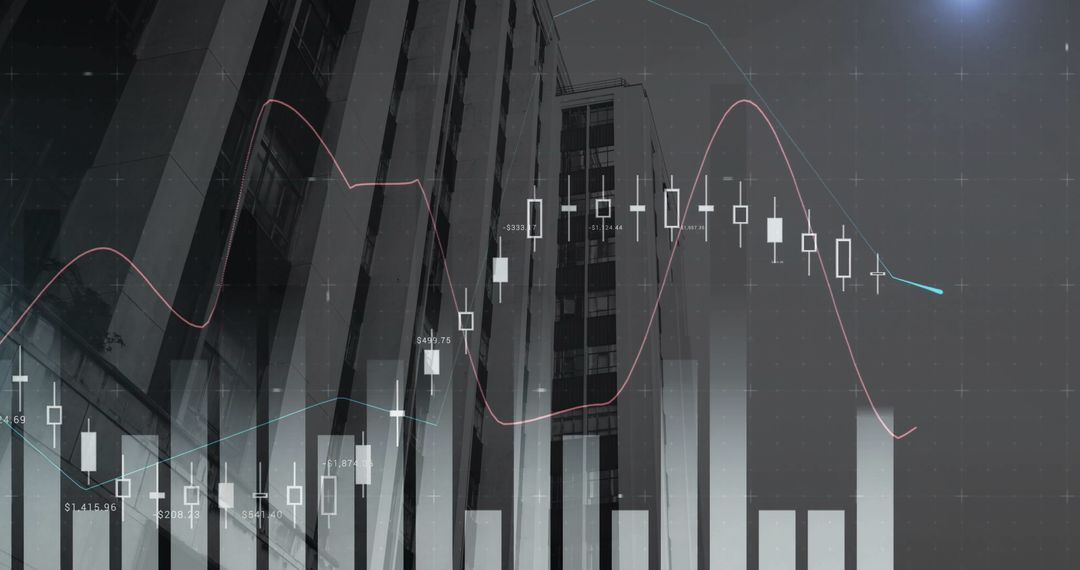
This visualization showcases abstract digital representations of financial data, focusing on stock market analysis with bars and lines. It illustrates economic trends and investment insights. Ideal for use in presentations focused on finance, business growth, market forecasts, technology development, or as a background for articles concerning economic analytics.

Powered by Shutterstock logo - Get 15% off with code: PIKWIZARD15
Online trading, Investment, Strategy market plan, and Stock mark - Powered by Shutterstock - Get 15% off with code: PIKWIZARD15Man look at the dashboard with graphs and charts. Concept of data management system, business intelligence, data statistics, marketing analysis, key performance indicators (KPI) and analytics. - Powered by Shutterstock - Get 15% off with code: PIKWIZARD15Financial stock market numbers and city light reflection - Powered by Shutterstock - Get 15% off with code: PIKWIZARD15Stock market or forex trading graph and candlestick chart suitable for financial investment concept. Economy trends background for business idea and all art work design. Abstract finance background.
 - Powered by Shutterstock - Get 15% off with code: PIKWIZARD15Stock exchange market graph analysis background - Powered by Shutterstock - Get 15% off with code: PIKWIZARD15

Credit Photo

If you would like to credit the Photo, here are some ways you can do so

Free (free of charge)

Free for personal and commercial use.

Author: People Creations

Similar Free Stock Images

Abstract Financial Graphs with Bar Charts and Line Indicators
Premium
Display stock market numbers with defocused street lights background
Abstract Digital Financial Market Analysis Concept
Digital Financial Graphs and Charts Display
Financial Data and Graphs Overlaying a Cityscape
Digital Financial Chart Overlay on Urban Skyline
Premium
Stock market chart,Stock market data on LED display concept.
Financial Data Analysis with Urban City Background
Futuristic Digital Graphs Depicting Financial Market Trends
Financial Graphs on Cityscape at Dusk Illustrating Economic Trends
Financial Data and Statistics Analysis Concept
Premium
Businessman analyzing forex trading graph financial data. Business finance background.business finance technology and investment concept. Stock Market Investments Funds and Digital Assets.
Abstract Financial Market Analysis with Candlestick and Bar Charts
Business Data Analytics and City Architecture Collage
Digital Financial Graphs Over Cityscape Illustration
Dynamic Financial Graphs Overlapping Urban Cityscape
Premium
Stock market chart with green candlesticks going up indicating crypto rising in value. Graphical representation of volumes and time intervals of digital cryptocurrency past price movements
Cityscape and Digital Charts Reflect Modern Business Analysis
Financial Data Analytics Overlayed on Cityscape
Financial Chart and Data Analysis Background Technology Concept
Data Analysis with Digital Financial Charts in a Virtual Space
Premium
Investors analyze the data stock market index via smartphone screen to trade the stock chart for planning investments take profit, trade stock exchange market and cryptocurrency data, financial.
Financial Data and Math Equations on Digital Screen Interface
Financial Data Charts Indicating Market Trends
Financial Graphs and Charts on Digital Interface
Digital Financial Data Analysis with Stock Market Graphs
Premium
Financial stock exchange market display screen board on the street, selective focus
Digital Health Analytics Data Overlaid on Doctor Consultation
Abstract Financial Data Visualization with Bar and Line Graph
Dynamic Financial Data Interface with Changing Statistics
Candlestick Charts with Moving Averages over Cityscape
Financial Data Analytics Digital Display With Dynamic Charts
Financial Data Charts Overlay on Modern Office Workspace
Premium
Businessman analyzing forex trading graph financial data. Stock Market Investments Funds and Digital Assets. Business finance technology and investment concept. Business finance background.
Financial Data Analysis with Cityscape Overlay
Financial Data and Graphs Overlaying Cityscape
Abstract Financial Data Visualization with Soft Lights
Financial Data Over Cityscape with Digital Interface Theme
Premium
Stockmarket online trading chart candlestick on crypto currency platform. Stock exchange financial market price candles graph data pattern analysis concept. Computer screen closeup background
Dynamic Forex Trading Graph for Financial Investment
Financial Graphs with Data Visualization in Office Background
Analyzing Financial Market Trends in Office Environment
Digital Interface with Financial Data Over Urban Landscape
Premium
Stock market or forex trading graph and candlestick chart suitable for financial investment concept. Economy trends background for business idea and all art work design. Abstract finance background.
Financial Graphs and Cityscape Represent Global Trade
Financial Graphs Over Cityscape Representing Global Trade and Economy
Financial Data Visualizations with Urban Backdrop
Abstract Financial Data Analyzing Over Dynamic Cityscape
Premium
Stock market or forex trading graph in futuristic concept suitable for financial investment or Economic trends business idea and all art work design. Abstract finance background
Abstract Digital Wave with Financial Data Visualization
Dynamic Financial Data Feed with Graphs and Figures
Financial Data Overlay on Office Building Background
Financial Data Overlay on Cityscape Illustrating Market Analytics
Premium
Man look at the dashboard with graphs and charts. Concept of data management system, business intelligence, data statistics, marketing analysis, key performance indicators (KPI) and analytics.
Dynamic Financial Graph Dropping Beneath Statistical Visualization
Abstract Financial Data Charts on Black Background
Abstract Financial Data Chart Over Cityscape
Financial Data Analytics Overlapping Modern Cityscape
Premium
Business man holding tablet and showing holographic graphs and stock market statistics gain profits. Concept of growth planning and business strategy. Display of good economy form digital screen.
Digital Stock Market Analysis with Graphs and Charts on Black Background
Evening Financial Data Analysis Overlay in Urban Business Office
Digital Analytics Data Futuristic Nighttime Cityscape
Digital Financial Data Processing Indicators on Blue Background
Digital Financial Market Analysis Over Modern Office Background
Advanced Data Processing with Trend Charts on Black Background
Premium
Stock market chart displayed rapid growth in economy, driven by technology investments, financial data highlighted key trends in business and finance. stock, market, graph, chart, finance, business.
Abstract Financial Data with Graphs Over Cityscape
Data Analysis and Market Trends with Business Professional
Business Professionals in Modern Office Analytics Overlay
Statistical Data Analysis with City View from Office
Premium
Stock graph and financial chart. Analyze stock market finance volume of stock market with Graph and chart holograph technology. High quality photo
Futuristic Financial Data Dashboard with Graphs
Financial Data Visualization Overlaying Business Meeting Scene
Financial Data and Statistics Analysis with Graphs
Abstract Digital Financial Chart with Analysis Interface
Premium
Male trader sits at desk hold smart phone with stock market data, using laptop display graph and chart, analyzing investment, check trading stocks information, view over shoulder. Growth, profit, apps
Dynamic Financial Graphs Overlaying Cityscape for Global Economy
Mixed Reality of Financial Growth Charts and Cityscape
Abstract Financial Data Analysis with City Skyline
Financial Graphs Overlay Against Cityscape Skyline View
Premium
Financial stock exchange market display screen board on the street, selective focus
Abstract Financial Data and Trends Analysis
Financial Data Interface with Urban Cityscape Backdrop
Financial Data and Technology Illustration with Cityscape Background
Digital Financial Data Analysis Visualization with Graphs
Premium
Display stock market numbers with defocused street lights background
Financial Graph Over Urban Cityscape Illustration
Financial Growth Trends with Digital Overlay in City
Cityscape Overlay with Financial Data Charts and Graphs
Abstract Financial Data Overlay with City Skyline
Premium
Black Businessman Holding Smartphone and Checking Stock and Cryptocurrency Market in Office. African-American Businessperson using Internet with Mobile Phone Device. Over Shoulder Shot
Financial Charts Superimposed on City Skyline at Night
Neon Financial Dashboard Over City Skyline Showing Candlestick Charts and Growth Analytics
Financial Data Analyzing and Architectural Planning
Global Financial Data with Digital Chart Interface
Stock Market Graphs Overlaying Busy City Traffic
Dynamic Financial Graph Overlay on Cityscape for Business and Technology
Premium
Financial accounting of profit summary graphs analysis. The business plan at the meeting and analyze financial numbers to view the performance of the company in stock market exchange.
Data Visualization with Financial Graphs in Modern Office
Data Analysis with 3D Financial Charts on Digital Interface
Dynamic Financial Growth in Bustling Cityscape
Cityscape at Night with Financial Graphs Symbolizing Market Trends
Premium
Stock market or forex trading graph and candlestick chart suitable for financial investment concept. Economy trends background for business idea and all art work design. Abstract finance background.
Businessman Analyzing Digital Data with Financial Graphs
Cityscape Overlaid with Dynamic Financial Graphs and Market Trends
Abstract Financial Data Analysis with Cityscape Overlay
Dynamic Financial Growth Charts Overlaying Urban Cityscape
Premium
Stock market chart,Stock market data on LED display concept.
Futuristic Data Visualization with Cityscape Hybrid
Abstract Digital Data and Cityscape Overlay
Advanced Business Data Analytics over Urban Cityscape
Digital Data Bar Graph over Global Financial Grid
Premium
Stock market graph trading analysis investment financial, stock exchange financial or forex graph stock market graph chart business crisis crash loss and grow up gain and profits win up trend.
Financial Data Analytics Over Cityscape Blue Tones
Digital Financial Stock Market Data Analysis Chart
Futuristic Data Analysis with Graphs and Formulas
Global Data Visualization with World Map and Bar Graphs
Premium
Investor trader broker analyzing financial crypto stock trade market on smartphone risk digital price data in mobile app buying bank shares, doing investment strategy analysis on phone. Over shoulder.
Digital Financial Data Overlay on Cityscape Horizon
Abstract Financial Data and Charts in Urban City Background
Abstract Financial Data with Dark Urban Background
Digital Financial Charts over Urban Cityscape Background
Premium
Finance trade manager analysing stock market indicators for best investment strategy, financial data and charts with business buildings in background
Projecting Financial Charts Over Modern Architectural Corridor With Candlestick Graphs